Galton’s regression to and away from the mean
Received: 04-May-2022, Manuscript No. PULJMAP-22-4906; Editor assigned: 06-May-2022, Pre QC No. PULJMAP-22-4906(PQ); Accepted Date: May 20, 2022; Reviewed: 16-May-2022 QC No. PULJMAP-22-4906(Q); Revised: 17-May-2022, Manuscript No. PULJMAP-22-4906(R); Published: 30-May-2022, DOI: 10.37532.2022.5.3.1-7
Citation: Dennis de Champeaux. Galton’s regression to and away from the mean. J Mod Appl Phys. 2022; 5(3):1-7.
This open-access article is distributed under the terms of the Creative Commons Attribution Non-Commercial License (CC BY-NC) (http://creativecommons.org/licenses/by-nc/4.0/), which permits reuse, distribution and reproduction of the article, provided that the original work is properly cited and the reuse is restricted to noncommercial purposes. For commercial reuse, contact reprints@pulsus.com
Abstract
Francis Galton’s achievements include the phenomenon of IQ regression to the mean of descendants in a hereditary context. A naïve interpretation yields that subsequent generations ultimately converge to the mean of the distribution, a fix point. We provide a simple assumption regarding descendants so that we obtain a counter balancing force, regression away from the mean, which will preserve an initial distribution. The argument is supported by ‘experimental’ statistics. We discretize a normal distribution, and subsequently replace many times a parent by a child, where a parent and a child are generated randomly, while the child is constrained by the regression equation. Our simple assumption guarantees that the original distribution is preserved. We obtain the regression to the mean effect from the perspective of the parent and a regression away from the mean effect from the perspective of the descendants. Our assumption, and others, corresponds, we believe, with a conjecture about the ‘Mechanics’ for the generation of a specific heritable trait.
Keywords
Distorted-geometry; Radial-extensions; Geometry; Regression; Structural stability
Introduction
Regression to The Mean (RTM) has also a different meaning than what is discussed in this paper, which we need to clarify upfront. Measurements that have a significant amount of noise keep creating unrealistic outliers. By keeping track of a series of measurements one is able to get to a ‘good’ value by taking, say, the mean of the series. The entry states “In statistics, regression toward the mean (…) is a concept that refers to the simple fact that if one sample of a random variable is extreme, the next sampling of the same random variable is likely to be closer to its mean [1].” The [Brittanica] entry starts with “RTM, a widespread statistical phenomenon that occurs when a nonrandom sample is selected from a population and the two variables of interest measured are imperfectly correlated [2]. The smaller the correlation between these two variables, the more extreme they obtained value is from the population mean and the larger the effect of RTM (that is, there is more opportunity or room for RTM).” The [Barnett] entry starts with “RTM is a statistical phenomenon that can make natural variation in repeated data look like real change. It happens when unusually large or small measurements tend to be followed by measurements that are closer to the mean [3].” Yet another entry [Study] starts with “RTM is a statistical phenomenon stating that data that is extremely higher or lower than the mean will likely be closer to the mean if it is measured a second time. “Remarkably enough all these sources proceed by discussing the Galton story about RTM. We consider this unfortunate. RTM is an easy concept when dealing with measuring/observing a sequence of data that contains varying amounts of noise. Obtaining a mean, an average, removing first outliers, etc. are intuitively easy notions to apply when RTM is to be addressed. RTM in the context of Galton’s genetic heritability is a different ‘animal’; it is not just statistics, genetics is the driver as elaborated below. RTM in the Galton’s context does not deal with the variability in a single stream of data. Instead statistic effects play a role on all elements that are part of a normal distribution where parent-child mutations occur. There is indeed a notion of RTM between the parent-child mutation, but a non-statistical, empirical component prevents the normal distribution to converge to a fix point as a result of the RTMs of the parent-child mutation. This paper adds a component to a heritability equation and demonstrates through a statistical simulation how RTM occurs in a Galton context with preservation of the sigma of a normal distribution.
A 2nd motivation is the following quote The reason that the populations don't collapse into uniform mediocrity ... is that the tails of the distributions are constantly being replenished by the occasional very tall child of taller-than average parents and very short child of shorter-than-average ones.
This quote was encountered on page 253 of Pinker’s “Rationality” [Pinker2] [4]. While Steven Pinker is one of my heroes, this explanation doesn't cut it.
Preliminaries
Francis Galton observed that the IQ of children regressed to the mean of the population from the perspective of the parents [Schacter]:
- Parents whose IQ is at either extreme are more likely to produce offspring with IQ closer to the mean (or average).
The question whether this effect is hereditary is muddled by potential contextual changes in the nurture of descendants: changes in nutrition, parental educational practices, societal educational resources, scientific progress impacting our conceptualizations, etc. When all these effects are eliminated the claim is still that there is some genotypic difference between parents and offspring regarding genotypic IQ (or say height) where:
- Parents whose IQ is at either extreme are more likely to produce offspring with IQ closer to the mean (or average). The ‘mechanics’ of RTM appears to be captured by the phenomenon that features like genotypic IQ (and heights, etc.) are constituted by configurations of many genes (unique for each individual) that gets reshuffled at each conception thereby reducing the replication of the non-average configurations in the parents.
While publications we have found describe the Galton version of RTM, few worry about the potential converge to a fix point. Pinker suggests in [Pinker2] the solution shown above. This not very correct description motivated us to revisit this topic and rewrite this note from years ago [4].
The Java code used to show the update of a normal distribution with parent-descendant pairs is available at [5].
Heritability equation
The remarkable feature here is that not only above average scoring parents yield lower scoring descendants but that the opposite happens as well: below average scoring parents yield higher scoring descendants. The formalization of this phenomenon, for IQ but applies to any heritable feature, is captured by the regression equation:
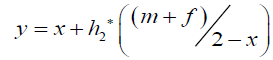
where
y is the predicted average IQ of the children
x is the mean IQ of the population to which the parents belong
h2 is the heritability of IQ with 0 < h2 < 1
m and f are the IQs of the mother and father, respectively.
The parameter h2 is an IQ specific constant to be determined by experimentation. This insight is not trivial because, as discussed above, we have for parents and children only phenotypic IQ values available, which are a composition of ‘hidden’ genotypic values overlaid by the (different) developments that parents and children have gone through.
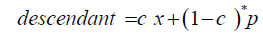
We simplify this equation with the substitutions:
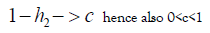
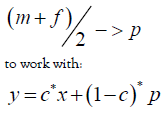
in which x is the mean of a distribution, p is the average of the parents, y is the average value of a descendant while c is one minus the heritability of IQ.
This formula suggests that subsequent generations creep towards the mean x of the distribution so that over time all members of the population have the value x. However, features like height, weight, IQ, etc. do not converge towards a mean. We provide a ‘fix’ for this semi paradox with an assumption about the parent-descendant statistical distribution.
Extending the heritability equation
The regression equation does not specify the type of the distribution of descendants given the value of p (the average of the parents – and we assume first that m=f). To develop fine grained details of the parent-descendant relationship we assume that they have a normal distribution with spread sigma C, where sigma C is a parameter that depends on the c-parameter. The parent distribution has, of course, a normal Gaussian distribution (with spread sigma). This gives the formula for a descendant of the parents with value p:

We obtain the Galton regression-to-the-mean effect due to 0
• Select randomly a parent using a Gaussian probability
• Select randomly a descendant for this parent using the descendant-formula above
• Delete the parent from the distribution of the population and add the descendant.
Using iterative refinement on sigmaC we can obtain a sigmaC value that yields a stable, spread sigma preserving, process that simulates the creation of a next generation: execute the parent-descendant operation 108 times. (The 108 value is just an adequate choice. See the appendix for an elaboration of the iterative refinement technique.)
For example:
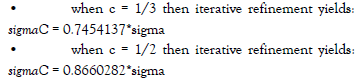
Given our experiments we have evidence for the theorem (based on the intermediate value theorem) that for each c with 0 [6]. We can check the value of sigmaC by generating many parent-descendant pairs and calculate the correlation coefficient for these pairs. We obtain with 200K parentdescendant pairs:sigmaC = 0.7454137 implies the parentdescendant correlation
correlation coefficient for these pairs. We obtain with 200K parentdescendant pairs:sigmaC = 0.7454137 implies the parentdescendant correlation coefficient of 2/3, and similarly sigmaC = 0.8660282 implies the parent-descendant correlation coefficient of 1/2. These correlation coefficients correspond indeed with the chosen ccoefficient in the regression equation. The supporting intuition here is: a larger c, thus more regression to the mean from the perspective of the parent, requires a larger sigma C to preserve the spread of the original distribution. Regression to the mean We tested replacements where the initial normal distribution has the mean value 100. During the replacement of 108 parents by descendants we were tracking for parents with p-value 90 and 110 the average value of their descendants. For c = 1/3 we obtain for parents with p-value 90 their descendants have the average value 93, and the parents with pvalue 110 have descendants with the average value 107. Similarly, for c = 1/2 we get for parents with p-value 90 their descendants have the average value 95, and the parents with p-value 110 have descendants with the average value 105.
Hence, we have confirmed that the regression equation and our assumption about the parent – descendant distribution yields indeed Galton’s regression to the mean phenomenon from the perspective of the parent.
Regression away from the mean
We tested also for descendants with y-value 90 and 110 the average of their parents. For c = 1/3 we obtain for descendants with y-value 90 their parents have the average value 93, and the descendants with y-value 110 have parents with the average value 107. Similarly, for c = 1/2 we get for descendants with y-value 90 their parents have the average value 95, and the descendants with y-value 110 have parents with the average value 105.
The characterization of the Galton breeder formula that it entails regression-to-the-mean is correct but not the full story. There is an opposite effect as well with the proper descendant distribution, as shown above.
Other extensions
We extended the heritability equation:
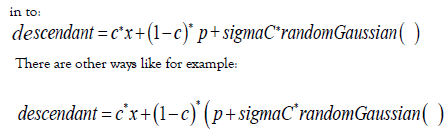
and likely there are more. These are different conjectures how genetics works; which one corresponds with the facts is definitely beyond our expertise.
Less assortative mating
The method described above made the assumption of perfect assortative mating: both parents have the same IQ. We obtain slightly different results for sigmaC when using parents with different IQs. We changed the method slightly: a second parent was constructed somewhat differently from the first parent using yet another normal distribution. The descendent is constructed by taking the average of the parents on top of the replacement process described above. The descendant is added to the distribution and one of the parents is removed.
Increasing the second parent spread from 1 to 10 causes the spread of the next generation to narrow steadily. Hence we re-determined sigmaC for the second parent spread equal to 5 and obtained for c = 1/2 a slight increase to sigmaC = 0.877588. Regression to and away from the mean remain unchanged with less assortative mating.
Assuming for the sake of the argument a stable society with the second parent spread equal to 5 and that for some reason assortative mating increases (hence the second parent spread decreases), we obtain as side effect (without other changes) that the spread of the population distribution increases.
Gender distribution differences
Yet another adjustment is required due to the different distributions that the two genders have, see Cronin (2009), Murray (2004), Mills (2011), Pinker (2002). There is agreement that the male sigmas (also for other species) are larger on many dimensions (which explains, among others, the politically incorrect glass ceiling). Since the magnitude of the difference is unknown for the (IQ) distributions (at least to us), we leave it to others to explore its, likely minimal, impact on the sigmaC’s [7-10].
Generational tragedy
Regression to and away from the mean applied to (genotypic) IQ harbors (a host of) conflicts. A parent below the mean may have to deal with a child being smarter; a parent above the mean may be confronted with a child being less smart. And the opposite happens from the perspective of the children. Reality is not as stark because parents have typically different IQs and thus a child could be close to one of them (and they have to learn to live with these differences anyway) [11-21].
Summary
We addressed the conundrum of the regression to the mean interpretation of Galton’s regression equation. To counter the naïve interpretation that convergence to a fix point would result, we constructed a parent-descendent relationship that exhibits regression to the mean as well as regression away from the mean. Both forces keep each other in check so that a stable distribution is obtained. For each value of the c-parameter (= 1-h2) in the regression equation we conjecture a unique sigmaC parameter that defines the parentdescendant distribution relationship. The solution changes slightly when we consider less assortative mating. Different extensions of the heritability equation yield different conjectures, we believe, about the ‘mechanics’ for the generation of a specific heritable trait.
Acknowledgments
The author received guidance from Gerhard Meisenberg and David Lavine.
REFERENCES
- Wikipedia. Regression towards the mean; 2022.
- Chen S., Regression to the mean. Britannica.
- Barnett AG, Van Der Pols JC, Dobson AJ. Regression to the mean: what it is and how to deal with it. Int J Epidem. 2005;34(1):215-220.Google Scholar Crossref
- Pinker S. Rationality: What it is, why it seems scarce, why it matters. Penguin; 2021.
- Schacter D; Gilbert D; Wegner, D. "Intelligence". Psychology (2nd ed.). New York: Worth Publishers; 2010: pp. 405-6.
- Galton. https://github.com/ddccc/Galton
- Cronin H, Brockman J. “More Dumbbells but More Nobels”, in “What have you changed your mind about”. Harper. 2009;97(2):511.
- Murray C. Human accomplishment: The pursuit of excellence in the arts and sciences. 800 BC to 1950. Google Scholar
- Mills, M. “How can there still be a sex difference, even when there is no sex difference”, in Psychology; 2011.
- Pinker, S., “The Blank Slate, The Modern Denial of Human Nature”, Penguin; 2002.
- Williams Y. Regression To The Mean in Psychology: Definition & Example. Study.
- Barnett AG, Van Der Pols JC, Dobson AJ. Regression to the mean: what it is and how to deal with it. Int J Epidem. 2005;34(1):215-220.
- Chen S., Regression to the mean. Britannica.
- Cronin H, Brockman J. “More Dumbbells but More Nobels”, in “What have you changed your mind about”. Harper. 2009;97(2):511.
- Mills, M. “How can there still be a sex difference, even when there is no sex difference”, in Psychology; 2011.
- Murray C. Human accomplishment: The pursuit of excellence in the arts and sciences. 800 BC to 1950.
- Pinker, S., “The Blank Slate, The Modern Denial of Human Nature”, Penguin; 2002.
- Pinker S. Rationality: What it is, why it seems scarce, why it matters. Penguin; 2021.
- Schacter D; Gilbert D; Wegner, D. "Intelligence". Psychology (2nd ed.). New York: Worth Publishers; 2010: pp. 405–6.
- Williams Y. Regression To The Mean in Psychology: Definition & Example. Study.
- Wikipedia. Regression towards the mean; 2022.