
Mathematical Modeling & Analysis of Diabetic Retinopathy
2 Assistant Professor KIET Group of Institutions, Ghaziabad, India, Email: dsobas@hbtu.ac.in
3 Professor HBTU, Kanpur, Professor, ABES Engineering College, Ghaziabad, India, Email: tarun.arora@abes.ac.in
Received: 25-Feb-2021 Accepted Date: Mar 11, 2021; Published: 18-Mar-2021, DOI: 10.37532/2752-8081.21.5.26
This open-access article is distributed under the terms of the Creative Commons Attribution Non-Commercial License (CC BY-NC) (http://creativecommons.org/licenses/by-nc/4.0/), which permits reuse, distribution and reproduction of the article, provided that the original work is properly cited and the reuse is restricted to noncommercial purposes. For commercial reuse, contact reprints@pulsus.com
Abstract
Diabetes is a disesase that no association blood stream through the body. In this issue the retinal blood releases and creates retinal growing known as edema. Diabetic happens because of high proportion of glucose in the blood, which is root cause of change in the retinal microvasculere. The objective of this paper to introduce numerical model to depict the diabetic retinopathy in disease segment. In this model we acquired the formula to locate the complete no of suspectable, infectable, and all out no diagnose tolerant inside fixed timespan and furthermore checked the soundness of generated model by utilizing Lasalle's Principle.
Keywords
Posterior segment; Lasalle’s principle; Plasma insulin; Diabetic retinopathy; Mathematical modeling.
Introduction
By the report of International Diabetic Fedration 2018, 463 millionpeoplesaresuffering from diadeties in all over worldand also predict that this data will increase uoto 700 million till 2045. Diabeties Mellitus (DM) leads root cause of diabetic retinopathy (DR). Diabetic retinopathyconsider as most importent causes for vision loss of partial blindness.The leval ofglucose is responsible to harm the veins in the retina. These veins can expand and spill or the veins may be block, preventing blood from going through and then anomalous fresh blood vessels develope on the retina. These progressions may be cause of vision loss.
As shown in Figure 1, there are two categories of diabetic retinopathy first one is Non Proliferative and second one is Proliferative diabetic retinopathy (NPDR & PDR).

Figure 1) Schamatic diagram of Diabetic Retinaopathy.
NPDR is the initial phase of diabetic eye illness. Numerous individuals with diabetes have it. WithNPDR, small veins spill, making the retina swell. At that situation when the macula swells, it is known as macular edema. This is the most well-known motivation behind why individuals with diabetes lose their vision. Likewise with NPDR, veins in the retina may be damage. This situationis known as macular ischemia. At the point when this situation occurs, the blood cannot reach at the macula. At times minuscule particles known asexudates can frame in the retina. These conditions may affect vision as well [1-7].
Generally it is seen that PDR develops the phase of diabetic eye disease. It happens when the retina begins developing fresh blood vessels. This is known as neovascularization. These delicate new vessels frequently bleed into the vitreous. On the off chance that they just drain a bit, you may see a couple of dull floaters. In the event that they drain a ton, it may hinder all vision. These fresh blood vessels can shape scar tissue. Scar tissue can make issues with the macula or lead a separated retina.
PDR is intense and can take both your focal and fringe (side) vision.
The DRS research bunch 1987 showed first to forestall further vision misfortune. The point that we can catch this unsafe movement lies great ahead of time of this PDR stage. Today, Medical science is enduring the exponential increment the ceaseless and degenerative illness. Diabetic Mellitus (DM) is a ceaseless and multifactorial infection. DM is main driver to build up the diabetic retinopathy. Complexities of DM are optional micro vascular and large scale wounds [8]. Additionally, Diabetic retinopathy is the root confusion of DM that makes vision misfortune in grown-ups of productive age as shown in Figure 2.

It is likewise predict that by 2030, 191 million individuals will endure the issue of diabetic retinopathy and 56.3 million individuals with vision compromising diabetic retinopathy (VTDR) [9]. At forestall level, we utilized a gadget to locate the degree of glucose and insulin in the blood [10] just as circulatory strain, blood lipid levels and perceive the retinal sore [11] and analyze level the gadget to utilize picture handling stand apart [12,13].
The support of bio Engineer in VTDR, sort of characteristic and social history of medical issue which are identified with diabetic retinopathy. The danger factor (hyperglycemia, hypertension) are critical to decide the turn of events and advancement of diabetic retinopathy. We study the spread of ailment in the living organ in Epidemiology. The numerical demonstrating is extremely solid device to contemplate the Epidemiology of a disease. Verifiably numerous specialists have just utilized the numerical modeling to show the pace of spread of various irresistible illnesses, for example, COVID-19 [7], Rubela [1], HIV [2,3], Dengue fever [4,5], Ebola [6] and Zekavirous [5] as shown in Figures 3 & 4.

Figure 3) Information by map & projections on diabetes worldwide.

Figure 4) Schematic Diagram of normal eye & Diabetic eye.
The numerical demonstrating isn’t just use for infectious disease yet additionally non communicable issues. The basic significance of diabetes is level of sugar in the blood. At the point when a patient is confronting diabetic issue at that point as per clinical science the degree of sugar in the blood is in excess of 126 mg/dL. The diabetic issue creates when the pancreatic organs that are not produce adequate insulin. In the loss of insulin the cell of body cannot absorb and handle glucose into energy.
Now we can classify the DR as follows [14]
The supply of blood in all layers of retina is done through miniature veins which are vulnerable to over the top glucose level. At the point when the high measure of glucose accumulate in blood and veins betting because of low oxygen circulation to blood cells.
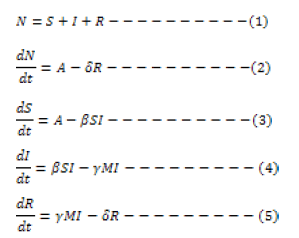
Mathematical Model
The Model condition depicting the rate of susceptible population, infected population and recovered is given as follows:
Solution of model
The solution of the model are given as follows
Using Eq.(1)(4) become
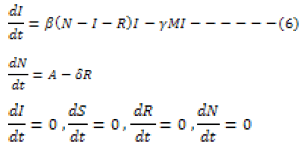
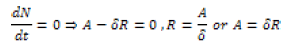
The above system equilibria has non nagative equilibria. They are related
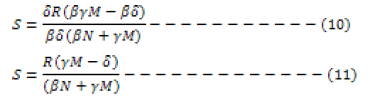
From Eq.(6)
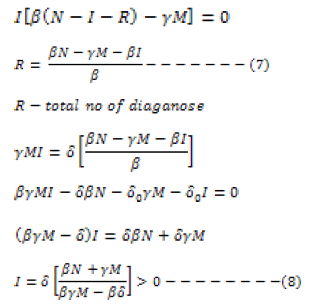
UsingEq. (8), 7 become
Now from (3)
Where
M-natural mortality rate,
γ-diaganose rate,
β-prevalence rate,
α-birth rate
δ-death rate due to complication,
I-Total no infected population
S-Total no suspected population,
R-Total Diagnose Population
Results and Discussions
The numbers of cases are increasing of DR. and influenced by no. of incidence that occur. The root cause of increasing diabetes cases due to unhealthy life style and low level of physical work and another main important factor is irregular eating pattern and unhealthy habits in daily life. Besides being by an unhealthy life style the cases of diabetes is also cause by genetic factors of parents who have hereditary history of diabetes. It is generally seen that those children who are facing the problem in childhood time,it may be possible that it is genetic disorder, also it is clinically proved that if the quantity of glucose increase in blood then the functioning of liver affected and insulin generated vassals does not generate the insulin in proper way result is diabetes.
We checked the stability of considering model By Lasalle’s Theorem, we checked the stability of above model:
According to Lasalle’s theorem (1960) to conclude G.A.S. of a system with only v ≤ 0, along with an observability type condition.
Consider V:In→I and I>0, Positive definite
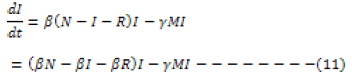
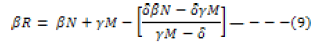
Now the replace the value of R from (7) in (11) we get
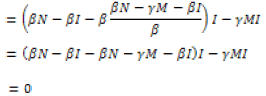
Hence
dI/dt=0 i.e.above model is globaly asymptoticaly stable [15].
This numerical model is worldwide acknowledged and now this model is additionally checked by WHO (World wellbeing association) data. In 2000, there were 150 million instances of diabetes around the world [16]. It was assessed in 2019 that this Figure 5 came to at 463 million for example simply significantly increasing inside 19 years so this outcome is basic for coming years [17-20].

Figure 5) Retinopathy.
Above model Figure 6 is steady as per Lasalle’s Theorem and we checked again the precision concurring United Nations information. In above model we see that I, S and R are the complete no of contaminated, suspected and absolute no of analyzed among of N populace separately. In above graph unmistakably as per WHO the standard N=1022. We examined the absolute no. of cases and complete no of commonness analyze quiet in various years.

Figure 6) Flow chart.
From above Figures 7-11 obviously tainted and analyze persistent increment and suspected perish in light of the fact that Suspected (Complications+ Non complexities) entanglement mean contaminated as contaminated increment at that point presumed decline as shown in Table 1.

Figure 7) Blue line shows birth rate and gray line shows death rate.

Figure 8) Graph between infected patient and Respective year.

Figure 9) Suspected and respective year graph.

Figure 10) Diagnose and respective year Graph.

Figure 11) Suspected, Infected and year graph.
| Year | α-Birth Rate% (1) |
δ-Death Rate % (2) |
Mortality(M) % (3) |
γ-diagnose rate % (4) |
β-prevalence rate % (5) |
Source |
|---|---|---|---|---|---|---|
| 2017 | 18.328 | 7.242 | 33.416 | 19.2 | 16.2 | 1,2[18] |
| 2018 | 18.02 | 7.237 | 32 | 19.2 | 16.2 | 3 [19] |
| 2019 | 17.806 | 7.273 | 30.924 | 19.2 | 16.2 | 4[20] |
| 2020 | 17.592 | 7.309 | 29.846 | 19.2 | 16.2 | 5[20] |
Table 1 Values of constants.
Conclusion
From above conversation ,we reason that this model is checked by WHO information likewise we determined an equation to discover number of suspected ,infectedand recovered number of analyze patients inside various years, additionally all diagrams which drawn by figuring by utilizing inferred recipes had same pattern like WHO information charts. This model likewise utilized for non-transferable ailments like disease, epilepsy, HIV and so forth. This model assumes a significant part to locate the all-out no. instances of non-transmittable ailments. In this paper these recipes apply for Diabetic Retinopathy patients however in future this model might be apply for some other non-transferable sicknesses.
Conflicts of Interest
The authors have no conflict of interest.
Acknowledgment
The authors are gratefullyacknowledging the constructive and fruitful comments of this research paper by reviewers of main manuscript.
REFERENCES
- Hethcote HW. Measles and rubella in the United States. Am JEpidemiol. 1983;117:2-13.
- Lin X. An epidemiological model for HIV/AIDS with proportional recruitment. Math Biosci. 1993; 118:181-195.
- Jacquez JA. Modeling and analyzing HIV transmission: the effect of contact patterns. Math Biosci. 1988;92: 119-199.
- Syafruddin S, Noorani MS. Lyapunov function of SIR and SEIR model for transmission of dengue fever disease. Int J Simulat Process Model. 2013;8:177-84.
- Rangkuti YM. Numerical analytic solution of SIR model of dengue fever disease in south Sulawesi using homotopy perturbation method and variational iteration method. J Math Fundam Sci. 2014;46:91-105.
- Bonyah E, Okosun KO. Mathematical modeling of Zika virus. APJTM. 2016; 6:673-9.
- Azizah A. Spread of Ebola disease with susceptible exposed infected isolated recovered model. J Phys Conf Ser. 2017:855:1.
- Ivorra B. Mathematical modeling of the spread of the coronavirus disease 2019 taking into account the undetected infections. The case of China. Comm Nonlinear Sci Numer Simulat. 2020; 88:105303.
- Chawla A. Microvasular and macrovascular complications in diabetes mellitus: distinct or continuum? IJEM. 2016;20:546.
- Zheng Y. The worldwide epidemic of diabetic retinopathy. IJOMBM. 2012; 60:428.
- Vashist SK, et al. Commercial smartphone-based devices and smart applications for personalized healthcare monitoring and management. Diagnostics. 2014 ;4(3):104-28.
- Squirrell DM, Talbot JF. Screening for diabetic retinopathy. J R Soc Med. 2003;96:273-6.
- Bawankar P. Sensitivity and specificity of automated analysis of single-field non-mydriatic fundus photographs by Bosch DR Algorithm—Comparison with mydriatic fundus photography (ETDRS) for screening in undiagnosed diabetic retinopathy. PLoS One. 2017;12:e0189854.
- Wong TY. Guidelines on diabetic eye care: the international council of ophthalmology recommendations for screening, follow-up, referral, and treatment based on resource settings. Ophthalmology. 2018; 125:1608-22.
- Shao H. Lyapunov exponents, sensitivity, and stability for non-autonomous discrete systems. Int J Bifurcat Chaos INT J Bifurcat Chaos 2018; 28:1850088.
- Definition WH. diagnosis of diabetes mellitus and intermediate hyperglycemia. Report of World Health Organization. IDF. Geneva. 2016:11-52.
- Saeedi P. Global and regional diabetes prevalence estimates for 2019 and projections for 2030 and 2045: Results from the International Diabetes Federation Diabetes Atlas. Diabetes Res Clin Pract. 2019; 157:107843.
- Luy M. A classification of the nature of mortality data underlying the estimates for the 2004 and 2006 United Nations’ World Population Prospects. C PoS. 2010; 35.
- World Health Organization. Contraception within the context of adolescents’ sexual and reproductive lives: country factsheet: Madagascar. WHO; 2020.
- Soumya HV. Knowledge, attitude and practice in diabetic retinopathy among patients with type 2 diabetes mellitus: A hospital based cross sectional study. Indian J Clin Exp Ophthalmol. 2020; 6:387-90.