
STRUCTURAL BREAKS IN CONSUMPTION OF TOBACCO IN KENYA
Received: 29-Mar-2021 Accepted Date: Apr 08, 2021; Published: 31-May-2021, DOI: 10.37532/2752-8081.21.5.30
This open-access article is distributed under the terms of the Creative Commons Attribution Non-Commercial License (CC BY-NC) (http://creativecommons.org/licenses/by-nc/4.0/), which permits reuse, distribution and reproduction of the article, provided that the original work is properly cited and the reuse is restricted to noncommercial purposes. For commercial reuse, contact reprints@pulsus.com
Abstract
The linear relationship between time series variables is normally assumed to be stationary or simply the mean and variances do not change over time and the covariance of a variable and its lagged values are constant over time. In real situations there are some major events that can influence the fluctuations of such time series variables. Structural changes can identify whether the linear relationship between independent and dependent variable changes over some time t. The main purpose of this paper is to highlight some of the major structural breaks in tobacco consumption in Kenya for the period 1980 to 2016. The data used was extracted from Kenya National Bureau of Statistics (KNBS) and Government statistical abstracts. The independent variables are the prices of tobacco both before and after tax and per capita income. The Zivot-Andrews test was applied to test one structural break, but Clement-Montane and Reyes test was used to identify the multiple structural changes. The results obtained were presented in a table form and figure for visual identification. Zivot Andrews showed that there were major and significant structural breaks in tobacco consumption in the year 2007(t-statistic value is -6.366), prices before tax in the year 1999(t-statistic value is -4.882) and per capita income had a break year 2006 (t-statistic value is -2.627). Clement Montane and Reyes results indicated that the variables under study had significant break years (p-values were less than 5 per cent significance level). Based on the results obtained, the consumption of tobacco had two major break structural breaks in the year, 1994 and 2003, similarly the income per capita break years were 1999 and 2009, also, the prices before and after-tax break years were in 1996 and 2003, and in 1995 and 2009 respectively. This structural change is an important observation in analysis as it improves the efficiency of the estimates and assist researches and governments to identify policies that can help reduce tobacco use, reduce diseases associated with tobacco for a functional healthy nation.
Keywords
Unit roots test, Zivot Andrews test, Clemente-Montañés-Reyes test, Univariate
Introduction
In the most economic and statistics research, the concept of stationarity is an important aspect because estimating parameters with variables which are not stationary leads to meaningless regression results and interpretation of such results would be misleading Granger et al. (2001). There are several conventional unit roots such as Augmented Dickey Fuller test and Phillip Perron unit tests. The problem arising in dealing with these conventional unit root test is that they do not allow for the possibility of a structural break. According to Phillip Perron test (1988), the power to reject a unit root decreases when the stationary alternative is true and structural break is ignored. Zivot and Andrews (1992) proposed a variation of Perron’s original test in which they assume that the exact time of the breakpoint is unknown. Instead a data dependent algorithm is used to proxy Perron’s subjective procedure to determine the break points. Clement Montane and Reyes test proposed by Clemente-Montañés-Reyes (1998) incorporate more than one major structural break to overcome Zivot and Andrews test which only considers one structural change.
Objectives of the Study:
The general objectives of the study was to determine if the exogenous shocks on the tobacco prices before and after tax and income per capita causes changes in tobacco consumption in Kenya.
Research Methodology
The data obtained from economic surveys and published statistical abstracts by (KNBS) was for the period 1980 to 2016.It is a time series data which are characterized by irregular fluctuations, seasonality and increasing or decreasing trend. Therefore, time series analysis involves a series that is stationary or non-stationary. That is the mean, variance and covariance does not change or it changes with a specified time respectively. The Zivot & Andrews and Clement & Montane Reyes methods were used in testing the presence of unit roots which indicates the non-stationarity and hence the existence of structural breaks. If there are structural breaks then the data is to be differenced in order to make the change so that a stationary data is obtained before any analysis
Unit Root Test with Structural Breaks
The typical assumption when performing standard time series analysis was that the series were stationary, meaning that the mean and variance do not change over time. That is, the series satisfies the following conditions:
 (1)
(1)
 (2)
(2)
 (3)
(3)
The issue was that, when structural breaks were present then these conditions do not hold; either there was a change in the mean or variance or both at a point in time(s). This would have an effect on the inference analysis and forecasting. The following tests below were used to test the presence of unit root using STATA statistical software.
Zivot-Andrews (1992) and Clemente-Montañés-Reyes (1998) tests were used. The models that were estimated are as follows;
Zivot Andrews Unit Root Test with Structural Break
The conventional unit root tests can yield misleading results when the data series exhibits shocks. Therefore, the Zivot and Andrews, (1992) test was used in the analysis, as it treated the selection of the break points as the outcome of an estimation procedure. The Zivot and Andrews (1992) test, tests the null hypothesis of the unit root against the alternative of a one-time structural break with three models: Model A allows a one-time change in the level of the series, Model B permits a one-time change in the slope of the trend function of the series and Model C allows both changes. The regression equations corresponding to these three models are as follows:
Model-A: 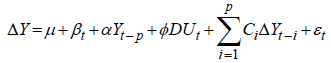 (4)
(4)
Model-B: 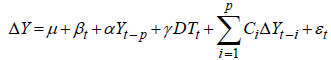 (5)
(5)
Model-B: 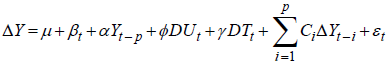 (6)
(6)
Where DUt and DTt are break dummy variables for a mean shift and a trend shift, respectively. The shift occurs at each possible break point: . This is stated formally as:
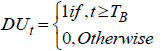 and (7)
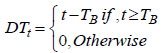 (8)
(8)
Where p is the number of optimum lags determined for each possible break point by one of the information criterion. The null hypothesis is α = 0, which implies that the series exhibits a unit root with a drift and excludes any structural break points. The alternative hypothesis is α< 0, which implies that the series is trend-stationary with an unknown one-time break. Therefore, equations (1), (2), and (3) are sequentially estimated and TB is chosen so as to minimize the one sided t-statistics for testing the hypothesis;
Clemente-Montañés-Reyes Unit Root Test with Two Structural Breaks
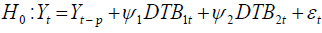
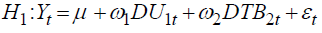
The Zivot Andrews test incorporates only one structural break in the data even if more than one break is present. To overcome this issue, the unit root test is applied. This test has the following representation of the null hypothesis that is, and alternative hypothesis that is:
 (9)
(9)
 (10)
(10)
In equation (9) and equation (10), DTBit is the pulse variable equivalent to 1 if t =TBi +1 and zero if otherwise. Moreover DUit =1,
If TBi <t (i =1,2,...) and if this assumption is violated then it is equal to zero. The modification of the mean is represented by the time periods
TB1 and TB2. Further, it is simplified with the assumption that TBi =ΨiT (i =1,2) where 1 > Ψ > 0 while Ψ1 <Ψ2 Clemente-Montañés-Reyes (1998). If an innovative outlier contained two structural breaks then the test for unit root hypothesis is performed with the following equation:
 (11)
(11)
This equation is used to estimate the minimum value of the t-ratio through simulations and the value of the simulated t-ratio was utilized to identify all break points if the value of the autoregressive parameter is constrained to unity (1).
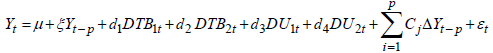
For the derivation of the asymptotic distribution of the said estimate, it is supposed that Ψ2 >Ψ1 >0 : 1>Ψ2 −1>Ψ0 : Ψ1 and Ψ2 obtained the values in the interval that is, [( t + 2) /T, (T −1) /T] by appointing the largest window size. Further, Ψ1 < Ψ2 + 1 is used to show that cases where break points existed in repeated periods are purged as shown by Clemente-Montanes-Reyes (1998). To test the unit root hypothesis, a two-step approach is used for the case when shifts are in a better position to explain additive outliers. In the first step, the deterministic variable is eliminated from the estimation with the use of the following equation:
 (12)
(12)
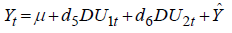
Then, in the second step, the minimum t-ratio is searched and hypothesis is tested with the following equation:
 (13)
(13)
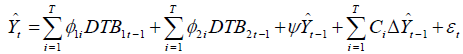
To ensure that min  converged, with the distribution, a dummy variable is included in the estimated equation for estimation:
 (14)
(14)
Results and Discussion
In the preliminary results, the descriptive statistics; mean, its minimum and maximum, standard deviation were computed using the standard formulae. The average value of the price of tobacco before tax was found to be Ksh.40.70784, with the minimum value of Ksh.4.68 and the maximum of Ksh.79.23.Similarly, the price of tobacco after tax was found with the mean of Ksh.52.83351 and minimum value Ksh.7 and maximum value of Ksh.150. In addition, the income per capita was also found to be with a mean of 588.2929, with standard deviation of 351.1647 and also the minimum value and the maximum value of Ksh.223.3348 and Ksh.1455.36 respectively. The total tobacco consumption in Kenya from the year 1980 to 2016 was again found to be with the average of 12598.3 tonnes, minimum 2738 tonnes and maximum of 25000 tonnes.
Univariate Properties of Time Series Variables
The time series variables under study were plotted, before specification and estimation of the econometric models were obtained. From the visual inspection shown in Figure 1, the plot showed that the tobacco consumption exhibits trends with drift whereas other study variables such as price before tax, price after tax and income per capita exhibited exponential trend. An exponential trend exhibits constant proportional growth, (Hamilton, 1994). Therefore, for these variables the current change in the variable was a constant fraction of the current value of the specified variable. These variables were specified to follow a unit root; therefore, the result was that the rate of growth of the series followed a stationary stochastic process. This implied that the overall trend and the deviations from trend had a proportional variance to the current level.

Figure 1: Visual Inspection of each univariate time series variable.
Zivot Andrews Unit Root Test with Structural Break
Ben-David and Papell (1997), Nunes, L. C., Newbold, P., & Kuan, C. M. (1997) stated that breaks in the trend were important aspects of unit root estimation in the presence of structural break. They further showed that if there was no upward trend in data, the test power to reject the no-break null hypothesis was reduced as the critical values increased with the inclusion of a trend variable. However, in contrast, Ben-David and Papell (1997), Stock, J. H. (1994) have shown that if the series exhibits a trend, then estimation of the model without trend may fail to capture some technical and important characteristics of the data. The results of the Zivot-Andrews test in table 1 (see also Figure 2) showed that there was a structural break in the year 2007 for tobacco consumption and 2006 income per capita this maybe attributed by pre electioneering period and the political instability in the country caused by post-election violence that stuck the country in 2007/2008.
| Variable | Observations | t-statistic | Break year |
|---|---|---|---|
| Consumption | 28 | -6.366 | 2007 |
| Price before tax | 20 | -4.882 | 1999 |
| Price after tax | 31 | -0.488 | 2010 |
| Income per capita | 27 | -2.627 | 2006 |
*The critical values for Zivot and Andrews test were -5.34, -4.80 and -4.58 at 1 %, 5 % and 10% levels of significance respectively.
Source: STATA Version 12 Data Analysis Results 2018
Table 1 Results of Zivot Andrews Unit Root Test with one Structural Break

Figure 2: Results of Results of Zivot Andrews Unit Root Test with one Structural Break
There were also breaks in the year 1999 for price before tax and this is the year when the country was undergoing insecurity issues and threats after al Qaeda attack of US embassy headquarters in Nairobi in1998. Furthermore, in the year 2010, there were structural break in the price after tax. The table 1 shows that both the consumption, price before tax and income per capita were statistically significant (all |t|>1.96).
Clemente-Montañés-Reyes Unit Root Test with Two Structural Breaks
The results of Clemente-Montañés-Reyes Double Additive Outlier (AO) Unit Root Test with Two Structural Breaks are reported in figure 3 and Table 2 below. The table showed that most of significant endogenously determined structural breaks for the variables under investigation corresponded closely to the financial and economic crisis of 1990-1997 GoK (1998) and massive injection of money in the economy in the run-up to the multi-party elections of the year 2002.

Figure 3: Clemente-Montañés-Reyes Unit Root Test with Two Structural Breaks
| Variable | Breaks | Coef. | t-statistic | p-value | Year |
|---|---|---|---|---|---|
| Consumption | Du1 | 9736.3111 | 6.568 | 0.0000 | 1994 |
| Du2 | -1357.5983 | -0.891 | 0.3820 | 2003 | |
| Price before tax | Du1 | 36.6556 | 10.816 | 0.0000 | 1996 |
| Du2 | 25.1263 | 7.102 | 0.0000 | 2003 | |
| Price after tax | Du1 | 45.2620 | 7.656 | 0.0000 | 1995 |
| Du2 | 59.4757 | 7.932 | 0.0000 | 2009 | |
| Income per capita | Du1 | 234.1348 | 4.147 | 0.0000 | 1999 |
| Du2 | 612.3235 | 8.523 | 0.0000 | 2009 |
Source: Authors’ Computation. STATA Version 12 Output
Table 2 Clemente-Montañés-Reyes Unit Root Test with Two Structural Breaks
It can be observed from the table that there was significant structural breaks (Du1) and (Du2) for all of the variables under investigation (all p-values =0.0000<0.05 level of significance), with the exception of tobacco consumption in 2003, though there was a structural break but insignificant for unit root test (p-value = 0.3820>0.05 level of significance).
Conclusion
The conventional methods of unit root tests were carried to test whether the data exhibits the stationarity property among each univariate variable, and it was found there was a unit root at some level of confidence. The data used had unit root at their levels, but became stationary upon first differenced. Further, Zivot Andrews and Clemente Montañés and Reyes test for unit root test with structural breaks was applied. The structural breaks were found out to be variable specific and associated certain economic phenomena. These changes can be associated with change in policies by government to curb tobacco consumptions, impose of excise taxation, change in government regimes. Other factors that can bring this sudden fluctuation is the natural catastrophic such as heavy rains that can affect tobacco production and eventually causes reduction in tobacco use. This research study recommends that from these findings the government through policy formulation on tobacco pricing taxation to reduce cigarette smoking and ensure a healthy nation thus promoting productive economy and also improve social wellbeing of its citizens.
REFERENCES
- Granger IV CW, Hyung N, Jeon Y. Spurious regressions with stationary series. Applied Economics. 2001;33(7):899-904.
- Phillips PC, Perron P. Testing for a unit root in time series regression. Biometrika. 1988;75(2):335-46.
- Clemente J, Montañés A, Reyes M. Testing for a unit root in variables with a double change in the mean. Economics letters. 1998;59(2):175-82.
- Nunes LC, Newbold P, Kuan CM. Testing for unit roots with breaks: evidence on the great crash and the unit root hypothesis reconsidered. Oxford Bulletin of Economics and Statistics. 1997;59(4):435-48.
- Stock JH. Unit roots, structural breaks and trends. Handbook of econometrics. 1994;4:2739-841.
- Papell DH, Ben-David D. Slowdowns and meltdowns: postwar growth evidence from 74 countries. NBER; 1997.
- Ochanda MM. Effect of financial deepening on growth of small and medium-sized enterprises in Kenya: A case of Nairobi County. IJSSE. 2014;1(11):191-208.
- Hamilton JD, Owyang MT. The propagation of regional recessions. Review of Economics and Statistics. 2012 Nov 1;94(4):935-47.
- Zivot E, Andrews DW. Further evidence on the great crash, the oil-price shock, and the unit-root hypothesis. Journal of business & economic statistics. 2002;20(1):25-44.