Tumor suppressor insufficiency: what’s in an expression?
Received: 15-Oct-2018 Accepted Date: Oct 18, 2018; Published: 28-Oct-2018
Citation: Kim S. Tumor suppressor insufficiency: what’s in an expression?. J Mol Cancer. 2018;1(3):15-16
This open-access article is distributed under the terms of the Creative Commons Attribution Non-Commercial License (CC BY-NC) (http://creativecommons.org/licenses/by-nc/4.0/), which permits reuse, distribution and reproduction of the article, provided that the original work is properly cited and the reuse is restricted to noncommercial purposes. For commercial reuse, contact reprints@pulsus.com
Keywords
Haploinsufficiency; Tumor suppressors; Gene expression; Breast cancer recurrence; Drug resistance
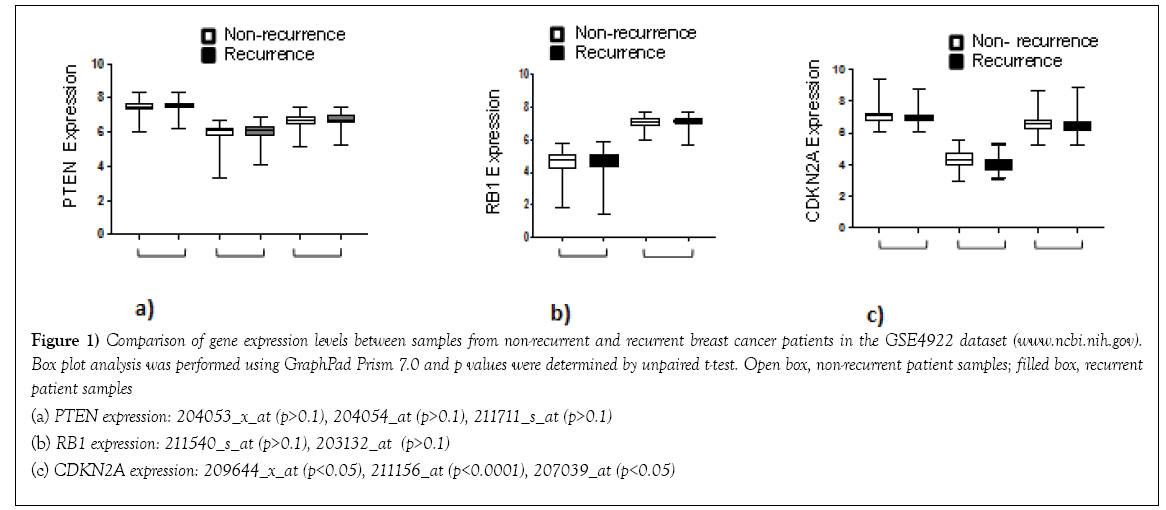
The elegant deduction of Alfred G. Knudson in his two-hit hypothesis of retinoblastoma in 1971 paved the way for conceptual framing of the tumor suppressor genes and their functions, in which he predicted that depletion of both copies of the RB gene leads to tumor formation [1]. It satisfied a priori assumptions that two gene copies provide a built-in back up system for function in diploid organisms. After four decades, it is now evident that tumor suppressors often do not follow the logic of the 2-fold redundancy system in diploid cells. For example, TP53 heterozygous knockout mice developed tumors without losing the remaining TP53 copy [2]. A single copy deletion of the cell cycle inhibitor CDKN1B (p27kip1) gene also resulted in spontaneous tumor formation without the remaining gene copy disabled [3]. These observations led to the term, “haploinsufficiency of tumor suppressors,” that describes a condition in which a single gene copy deletion in diploid cells results in a functional deficit due to a reduced amount of the gene product [4,5]. This too provided a sound reasoning that underscored the function of tumor suppressors, which depends on the “amount” thereof. Recent studies of the PTEN tumor suppressor gene brought to light another concept, “obligate haploinsufficiency” which refers to the deleterious effects of homozygous PTEN deletion such that only a heterozygous deficient conditions of PTEN leads to tumor formation [6]. In this case, a Goldilocks principal is in effect that the just right amount of a tumor suppressor is necessary for tumors. A milliondollar question is then: what is an “insufficient amount” of a tumor suppressor that leads to tumor formation? Can the “amount” be quantified so that one could predict tumor formation accordingly? In the aforementioned mouse gene knockout studies, TP53 and CDKN1B heterozygous knockout mice developed tumors at a slower rate compared to the homozygous knockout mice, suggesting that the gene deletion status could be a quantifiable measurement to discern faster (homozygous deletion) vs slower (heterozygous deletion) tumors [2,3]. We investigated this using the MSK-IMPACT dataset via cBioPortal (www.cbioportal.org), specifically in the breast cancer cohort [7-9]. The cBioPortal report showed that TP53 gene deletion was relatively rare, detected only in 0.45% of the patient sample cohort (6 out of 1,918). CDKN1B gene deletion was also infrequent (0.5%, 7 out of 1,918) (Table 1). These deletions were categorized as “deep deletions” representing homozygous deletions. Notably, the deep deletion status of TP53 or CDKN1B did not stratify patients in Kaplan-Meir analysis (see Table 1; Deletion KM p-value). We then asked if other genes were prevalently deleted and correlated with patient survival outcomes. The top 10 most frequently deleted genes in the MSK-IMPACT breast cancer cohort are listed in Table 1. The genes included PTEN, CDKN2A, CDKN2B, RB1, and NF1, consistent with their well-characterized tumor suppressor functions. A simple cBioPortal navigation indicated that deletions of PTEN or RB1 correlated significantly with poor patient survival (Table 1 KM analysis p-values). These indicated that some of the tumor suppressor genes including RB1 do follow the Knudson’s model of homozygous gene deletion leading to aggressive cancer. We next investigated if gene mutations accounted for functional insufficiencies of other tumor suppressors. We found that 6 out of the 11 genes listed in Table 1 had mutation frequencies ranging from 1% to 7% (Table 1). As has previously been reported [10,11], TP53 was mutated in 35% of breast tumor samples associated with poor patient survival in the MSKIMPACT cohort, demonstrating that functional deficiencies of TP53 are caused mainly by mutations (Table 1). PTEN and RB1 mutations also correlated with poor patient survival (see Table 1; Mutation KM p-value). Thus far, in this short exercise, we have established that PTEN and RB1 are the tumor suppressors of which gene deletions and mutations both contribute to faster recurrence and poor survival in breast cancer patients, whereas TP53 functional deficits mainly arise from gene mutations. Another mechanism of functional deficiencies is aberrant gene expression. As gene expression profiles are available in many public datasets, we explored whether expression levels provided a quantifiable measurement for tumor suppressor insufficiencies. We investigated this using three gene expression datasets–GDS806, GSE4922, and GSE12093–available at the NIH NCBI site (www.ncbi.nih.gov) [12-13]. Since deep deletions of PTEN or RB were associated with poor patient survival, one would expect “zero” expression from homozygous deletion to contribute to a low median value in tumors from recurrent patients. The results showed no differences in PTEN or RB1 expression between non-recurrent and recurrent tumors (GSE4922 shown in Figures 1a and 1b). In addition, we found no statistically significant differences in the median or mean expression of the genes listed in Table 1 between non-recurrent and recurrent tumors, with one exception. CDKN2A (p16INK4a/p14arf) expression was lower with statistical significance in recurrent patient tumors in the GSE4922 dataset only (Figure 1c). Although statistically significant, the median value difference between non-recurrent vs recurrent tumors was nominal, certainly much less than a two fold, which is often used as a differential expression cut-off. Kaplan-Meir analyses did not show any survival differences between patients with tumors expressing lower vs higher than median expression of CDKN2A. Taken together, these suggest that the “insufficient amount” of tumor suppressors associated with aggressive cancer is not readily quantifiable using gene expression datasets. In summary, deep deletions and/or inactivating mutations can identify tumor suppressors and their functional deficits associated with aggressive disease. Gene expression however, is yet to be proven its utility to discern tumor suppressor deficiencies. It is possible that tumor suppressor insufficiencies drive tumor initiation but have less impact on tumor progression. In this case, all tumors would have “insufficient amounts” that are not quantifiably different between tumors. Alternatively, it is our current technology that is limiting to discern “low” vs “lower” expression of tumor suppressor genes. Moreover, gene expression profiling thus far have been conducted with bulk tumor samples, in which only the median or mean gene expression is measured. Considering the extent of intra-tumor heterogeneity reported in recent years, gene expression profiling may not have captured “lower” expression of tumor suppressor genes in a subpopulation of tumor cells responsible for aggressive disease progression. It is hopeful that this will be addressed in the near future as single cell technology is advancing rapidly. Ultimately, proteomics or protein profiling assays will be needed to assess the functional deficits of tumor suppressors. One or several of these technological advancements may enable us to define tumor suppressor “insufficiency” in a quantifiable term.
| Deletion frequency rank | Gene | Deletion frequency (%) | Deletion KM p value | Mutation frequency (%) | Mutation KM p value |
|---|---|---|---|---|---|
| 1 | MAP2K4 | 2.64 | - | 3.7 | - |
| 2 | PTEN | 2.49 | <0.00001 | 7.4 | <0.05 |
| 3 | CDKN2A | 2.42 | - | 1.04 | - |
| 4 | CDKN2B | 2.42 | - | 0 | n/a |
| 5 | RB1 | 1.21 | <0.00001 | 3.28 | <0.05 |
| 6 | EPHA7 | 0.9 | - | 0 | n/a |
| 7 | CXCR4 | 0.9 | - | 0 | n/a |
| 8 | CRLF2 | 0.83 | - | 0 | n/a |
| 9 | NCOR1 | 0.76 | - | 4.28 | - |
| 10 | PRDM1 | 0.68 | - | 0 | n/a |
| 10 | NF1 | 0.68 | - | 4.9 | - |
| 15 | CDKN1B | 0.53 | - | 1.46 | - |
| 22 | TP53 | 0.45 | - | 35.56 | <0.00001 |
KM, Kaplan-Meir survival analysis; - not significant p>0.05; n/a, not applicable.
Table 1: Genes ranked by the highest deletion frequency in the MSKIMPACT breast cancer dataset (www.cbioportal.org)
Figure 1: Comparison of gene expression levels between samples from non-recurrent and recurrent breast cancer patients in the GSE4922 dataset (www.ncbi.nih.gov).
Box plot analysis was performed using GraphPad Prism 7.0 and p values were determined by unpaired t-test. Open box, non-recurrent patient samples; filled box, recurrent
patient samples
(a) PTEN expression: 204053_x_at (p>0.1), 204054_at (p>0.1), 211711_s_at (p>0.1)
(b) RB1 expression: 211540_s_at (p>0.1), 203132_at (p>0.1)
(c) CDKN2A expression: 209644_x_at (p<0.05), 211156_at (p<0.0001), 207039_at (p<0.05)
REFERENCES
- Knudson AG Jr. Mutation and cancer: statistical study of retinoblastoma. Proc Natl Acad Sci USA. 1971;68:820-23.
- Venkatachalam S, Shi YP, Jones SN, et al. Retention of wild-type p53 in tumors from p53 heterozygous mice: reduction of p53 dosage can promote cancer formation. EMBO J. 1998;17:4657-467.
- Fero ML, Randel E, Gurley KE, et al. The murine gene p27Kip1 is haplo-insufficient for tumour suppression. Nature. 1998; 396:177-80.
- Santarosa M, Ashworth A. Haploinsufficiency for tumour suppressor genes: when you don't need to go all the way. Biochim Biophys Acta. 2004;1654:105-22.
- Payne SR, Kemp CJ. Tumor suppressor genetics. Carcinogenesis. 2005;26:2031-45.
- Berger AH, Knudson AG, Pandolfi PP. A continuum model for tumour suppression. Nature. 2011;476:163-9.
- Zehir A, Benayed R, Shah RH, et al. Mutational landscape of metastatic cancer revealed from prospective clinical sequencing of 10,000 patients. Nat Med. 2017;23:703-13.
- Cerami E, Gao J, Dogrusoz U, et al. The cBio cancer genomics portal: an open platform for exploring multidimensional cancer genomics data. Cancer Discov. 2012;2:401-4.
- Gao J, Aksoy BA, Dogrusoz U, et al. Integrative analysis of complex cancer genomics and clinical profiles using the cBioPortal. Sci Signal. 2013; 6:pl1.
- Kandoth C, McLellan MD, Vandin F, et al. Mutational landscape and significance across 12 major cancer types. Nature. 2013; 502:333-9.
- Ma XJ, Wang Z, Ryan PD, et al. A two-gene expression ratio predicts clinical outcome in breast cancer patients treated with tamoxifen. Cancer Cell. 2004;5:607-16.
- Ivshina AV, George J, Senko O, et al. Genetic reclassification of histologic grade delineates new clinical subtypes of breast cancer. Cancer Res. 2006;66:10292-301.
- Zhang Y, Sieuwerts AM, McGreevy M, et al. The 76-gene signature defines high-risk patients that benefit from adjuvant tamoxifen therapy. Breast Cancer Res Treat. 2009;116:303-9.


