Air Pollution Assessment of Boko Haram Affected Local Government Areas of Adamawa State, North Eastern Nigeria
2 Department of Chemistry, Modibbo Adama University, Yola, Adamawa State, Nigeria
3 Department of Chemistry, Federal University Lokoja, Kogi State, Nigeria, Email: muluh.khan@fulokoja.edu.ng
Received: 02-Dec-2021 Accepted Date: Dec 10, 2021; Published: 22-Dec-2021, DOI: 2021;5(6).
Citation: Muluh E Khan. Air Pollution Assessment of Boko Haram Affected Local Government Areas of Adamawa State, North Eastern Nigeria. J Environ Chem Toxicol 2021; 5(6)
This open-access article is distributed under the terms of the Creative Commons Attribution Non-Commercial License (CC BY-NC) (http://creativecommons.org/licenses/by-nc/4.0/), which permits reuse, distribution and reproduction of the article, provided that the original work is properly cited and the reuse is restricted to noncommercial purposes. For commercial reuse, contact reprints@pulsus.com
Abstract
This study is aimed at assessing the ambient air quality of Local Government Areas affected by Boko Haram insurgency. The study was conducted in both the rainy and dry seasons. Gasman portable gas monitor was used for the monitoring of CO, NO2, SO2, H2S, and Cl2. CO and H2S were found to be within acceptable limits set by FEPA (10.00 ppm and 8.00 ppm) respectively in both seasons in all locations except Hong LGA, where CO was 11.11 ppm. NO2, SO2 and Cl2 were all above acceptable limits of 0.06 ppm, 0.1 ppm and 0.01 ppm respectively. The Air Pollution Index rating indicated that all the locations were severely contaminated, except for Michika, Madagali and the control locations which were below 100 in the rainy season. The rainy season concentrations of these pollutants are lower than the dry season due to dissolution of the pollutants by the rains. The result of the pollution level is very poor and is a threat to the health of the populace. Thus this research recommends appropriate measures to be taken to enhance a safe environment for the people in these locations for healthy human living.
Introduction
Common forms of pollution that affects human life are air, water and soil pollutions. Air pollution is an unwanted condition which can be defined as the presence of substances in the atmosphere in such concentrations which are harmful to man and his environment including other forms of life and valuable materials. Air pollution is the introduction of particulates, biological molecules/particulate matter or other harmful materials into the earth’s atmosphere [11].
Common forms of air pollutants include Carbon monoxide (CO), Sulphur dioxide (SO2), Chlorofluorocarbons (CFCs), Nitrogen oxides (NOx) and heavy metals in form of particulates. According to Melaku et al., (2008) environmental sources for pollutants include construction and demolition activities, mining and mineral processing, wind-blown dust and mobiles and transportation related activities on the road. However in urban centers generally, human generated air pollution sources can be divided into mobile and stationary [9]. Today, mobile source emissions have tended to be the largest contributor to air pollution in many locations.
The effect of war is detrimental to the natural environment. The application of weapons, destruction of structures, fires, transports movements, chemical spraying are all examples of destroying impact on the environment [11]. Some of the biggest hazards of war range from toxic dust, air pollution and green-house gas emissions [15].
Boko Haram insurgency which is an irregular and an unconventional warfare is termed as terrorism. Their strategy involves the adaptation of some methods to achieve their goals. These involved bombings, kidnappings, guerilla warfare and others [3].
According to Intelligent Brief (Open briefing 2015) a civil society intelligence agency, stated that Boko Haram is known to possess a large number of assault rifles, rocket propelled grenades mortars and improvised bombs and shells. They also possess a large number of pickup trucks that have adapted to carry heavy machine guns. Most of their attacks were/are with the use of arm assault, in which firearms especially machine guns were the main types of weapons used. Those weapons are mostly incendiary, explosives and firearms [14]. The use of these weapons releases a lot of pollutions in the air. Most of the products of these firearms and explosives are released as CO2, CO, N2, H2, O2, SO2, CH4, H2S, and H2O [13].
Clean air is considered to be a basic requirement of human health and wellbeing. Air pollution has been a major environmental health problem, affecting both developed and developing countries [6]. Human health effects of poor air quality, are far reaching, and principally affect the body respiratory system and the cardiovascular system. Individual reactions to air pollutants depend on the type of pollutants exposed to, the degree of exposure and the individual’s health status and genetics [3].
This work is aimed at assessing the air quality of the Boko Haram affected Local Government Areas of Adamawa State and its implication on the health of the people in the locations. This will create awareness on the plight of the people in these LGAs and if remedial measures are taken, normal life, a fundamental human right will be enhanced.
Materials and Methods
Adamawa state is located in the North Eastern Nigeria within latitude 70 26’18” to 100 56’57” North of the equator and longitude 110 23’34” to 130 45’50” East of the Greenwich Meridian. The state is bounded by Borno State in the North, Gombe State in the West, Taraba State in the South and Cameroun Republic in the East.
The Study area (Madagali, Michika, Mubi North, Mubi South, Hong and Gombi) are located within latitudes 90 58’10” to 100 56’57” North of the Equator and longitudes 120 40’40” to 130 44’56” East of the Greenwich Meridian.
These Local Government Areas are bounding each other (neighboring Local Government Areas) and collectively bounded by Borno State in the North, Girei Local Government Area in the West, Song and Maiha Local Government Areas in the South and Cameroun Republic in the East. The study area has a collective area of 414.09623 square kilometers.

Figure 1: Map of the sample locations
Sampling sites were Madagali, Michika, Mubi North, Mubi South, Hong and Gombi Local Government Areas with a control in Numan Local Government, far off from the targeted areas.
The concentration of gaseous pollutants were determined on the site using mobile gas sensors manufactured by Crown Detection Instrument Ltd. Five gaseous pollutants were determined; CO, NO2, SO2, H2S, and Cl2. The measurements were carried in both dry and rainy seasons.
The study used measurements and statistical analysis to evaluate levels of air pollutants in the area. Assessment of air pollutant impact in the study area was based on the computed expedience factors (EF) as qi and Air pollution indices (API), FEPA (2012) and WHO (2003), comparing them with air quality standards for CO, SO2, NO2, H2S and Cl2. The expedience factor for each pollutant was computed using equation (1) and the resultant figures compared to API (Rao & Rao, 2005) using equation (2)
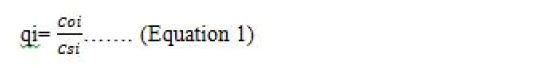
Where, qi = exceedence factor for ith parameter
Coi = Observed concentration of ith term
Csi = Recommended permissible standard concentration for the parameter.
CPCB (2006) has classified exceedence factor into four categories as follows;
q> 1.5 implies critical pollution (C)
q Between 1.0 - < 1.5 implies high pollution (H)
q Between 0.5 - <1.0 implies moderate pollution (M)
q<0.5 implies low pollution (L)
Air Pollution Index (API) is a numerical rating that indicates how polluted each sample location is. API rating scale as adopted by Ugbebor and Yorkor (2018), categorized API into clear air, high pollution, moderate pollution, heavy pollution and severe pollution: Table 1.
| S/No | Index Value | Rating | Health concern |
|---|---|---|---|
| 1 | 0 – 25 | Clear Air | Good |
| 2 | 26 – 50 | Light air pollution | Acceptable |
| 3 | 51 – 75 | Moderate air pollution | Unsatisfactory |
| 4 | 76 – 100 | Heavy air pollution | Unhealthy |
| 5 | >100 | Severe air pollution | Severe and unhealthy |
Table 1: API Rating Scale for Indices
API is determined using the following expression:.
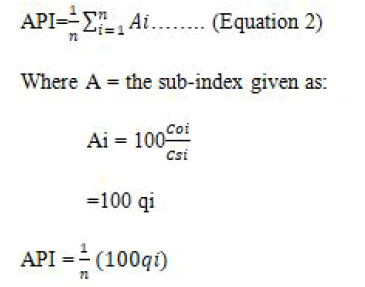
Source: Ugbebor and Yokor, (2018).
Results and Discussions
From Tables 2 and 3 , the critical pollutants are NO2, SO2 and Cl2 in all locations and in both seasons, while H2S has low pollutions in all locations in both seasons. CO is low in all locations except in Madagali and Hong with moderate pollution and lowest in Mubi North.
| Pollutants | |||||
|---|---|---|---|---|---|
| Local Govt. | CO | NO2 | SO2 | H2S | Cl2 |
| Mubi North | 4.00 | 0.49 | 0.24 | 4.17 | 0.07 |
| Mubi South | 5.33 | 0.44 | 0.36 | 2.44 | 0.08 |
| Michika | 5.67 | 0.32 | 0.20 | 3.16 | 0.07 |
| Madagali | 6.00 | 0.29 | 0.21 | 2.67 | 0.08 |
| Gombi | 10.00 | 0.72 | 0.21 | 5.56 | 0.11 |
| Hong | 11.11 | 0.53 | 0.63 | 5.22 | 0.10 |
| Control | 5.00 | 0.63 | 0.93 | 3.00 | 0.08 |
| Standard FEPA, (2012) | 10.00 | 0.06 | 0.1 | 8.0 | 0.01 |
Table 2: Mean Concentration of Air Pollutants in the dry season in ppm
| Pollutants | |||||
|---|---|---|---|---|---|
| Local Govt. | CO | NO2 | SO2 | H2S | Cl2 |
| Mubi North | 2.78 | 0.51 | 0.15 | 3.87 | 0.04 |
| Mubi South | 4.78 | 0.37 | 0.31 | 2.44 | 0.06 |
| Michika | 4.78 | 0.24 | 0.13 | 2.89 | 0.06 |
| Madagali | 5.33 | 0.28 | 0.14 | 2.39 | 0.05 |
| Gombi | 4.33 | 0.67 | 0.42 | 3.45 | 0.08 |
| Hong | 7.56 | 0.46 | 0.21 | 3.21 | 0.06 |
| Control | 3.25 | 0.31 | 0.11 | 1.11 | 0.02 |
| Standard FEPA, (2012) | 10.00 | 0.06 | 0.1 | 8.0 | 0.01 |
Table 3: Mean Concentration of Air Pollutants in the Rainy Season in ppm
Air Pollution Index rating of these locations signified heavy and severe pollution. Michika, Madagali and the control, fall within heavy pollution, while the rest are severely polluted. The API was lower during the rainy season. This agrees with the findings of [4] that higher values in the dry season may be due to temperature inversion, wind speed, wind direction, heat and low relative humidity Table 4-6.
| Pollutants | |||||
|---|---|---|---|---|---|
| Local Govt. | CO | NO2 | SO2 | H2S | Cl2 |
| Mubi North | 0.40 | 8.49 | 24.00 | 0.52 | 7.00 |
| Mubi South | 0.53 | 7.33 | 36.00 | 0.31 | 8.00 |
| Michika | 0.57 | 5.33 | 20.00 | 0.40 | 7.00 |
| Madagali | 0.16 | 4.83 | 21.00 | 0.33 | 8.00 |
| Gombi | 1.00 | 12.00 | 21.00 | 0.70 | 11.00 |
| Hong | 1.11 | 8.83 | 63.00 | 0.65 | 10.00 |
| Control | 0.50 | 10.50 | 93.00 | 0.48 | 8.00 |
Table 4: Exceedence factor for Dry Season
| Pollutants | |||||
|---|---|---|---|---|---|
| Local Govt. | CO | NO2 | SO2 | H2S | Cl2 |
| Mubi North | 0.28 | 8.50 | 15.00 | 0.48 | 4.00 |
| Mubi South | 0.48 | 6.17 | 31.00 | 0.31 | 6.00 |
| Michika | 0.47 | 4.00 | 13.00 | 0.36 | 6.00 |
| Madagali | 0.53 | 4.67 | 14.00 | 0.30 | 5.00 |
| Gombi | 0.43 | 11.17 | 21.00 | 0.40 | 8.00 |
| Hong | 0.76 | 7.67 | 42.00 | 0.40 | 6.00 |
| Control | 0.33 | 5.17 | 11.00 | 0.14 | 2.00 |
Table 5: Exceedence factor for rainy season
| LGA | Dry Season | Rainy Season |
|---|---|---|
| Mubi North | 161.64 | 113.04 |
| Mubi South | 208.68 | 175.84 |
| Michika | 133.20 | 95.32 |
| Madagali | 137.28 | 98.00 |
| Gombi | 183.00 | 248.00 |
| Hong | 334.36 | 143.32 |
| Control | 449.92 | 74.56 |
Table 6: Air Pollution Index (API) for Dry and Rainy Season
Temperature inversion limits the vertical circulation of air which results in air stagnation and trapping of gaseous pollutants in these locations. Slow wind condition in dry season give rise to build up high concentrations of pollutants.
The critical pollutants, NO2, SO2, and Cl2 in this study can cause adverse effects on health and the environment. NO2 is a respiratory irritant that can also corrode metal at high concentrations [7] and lowers the oxygen carrying capacity of blood. [11]
SO2 is produced by burning of coal and petroleum. High concentrations of it, causes chlorosis (yellowing of leaves), and plasmolysis (damage to micro membrane and metabolic inhibition).[11] Chlorine, Cl2 contributes to environmental problems such as ozone depletion, global warming and acid rain. Its health implication involves mucus membrane and irritation of the respiratory tract, inflammation of the lungs etc. [5]
Sources of air pollution vary, which can be due to mobile (transportation), stationary combustion, industrial process and solid waste disposal. [1] The areas of this study are not industrialized, so the possible sources of these high concentrations might have been from combustions, explosives released and heavy movements of vehicles which characterize the activities of Boko Haram in those locations. Nigeria has been rated fourth for air pollution across the globe and has the largest number of death due to air pollution in Africa. [8]
Conclusion
These locations need attention on how to remediate this high level of pollution. Continuous monitoring and creating awareness about the situation can help the communities. Different health conditions that can arise as a result of these states of pollutants should be given priority at the health sector by the federal government.
References
- USEPA. Guide to Environmental Issues. Doc No 520/B-94-01, United State Environmental Protection Agency, Washington DC. USA. 1993.
- Ugbebor JN, Yorkor B. Assessment of Ambient Air Quality and Noise levels around Selected Oil and Gas facilities in Nigeria. J Sci Res. 2018; 18(6): 1-11.
- Magaji JY, Hassan SM. An Assessment of Air Quality in and around Gwagwalada Abbatoir, Gwagwalada, Abuja FCT. J Environ Earth Sci. 2015; 5(1).
- Maitera ON, Louis H, Emmanuel YY, et al. Air Quality Index of CO and NO2 in Ambient Air of Jimeta/Yola. Metropolis, Adamawa State, Nigeria. 2018.
- Kruti D. Chlorine Monitoring. 2020.
- WHO. Health Aspect of Air Pollution with Particulate Matter, Ozone and Nitrogen Dioxide. 2003.
- Satoshi N, Eldred TT. Monitoring the levels of Toxic Air Pollutants in the Ambient Air of Freetown, Sierra Leone. Afr J Environ Sci Technol. 2012; 6(7): 283-292.
- Diana D. Dealing with Air Pollution in Nigeria. 2019.
- Bilos C, Colombo JC, Skorupka CN, et al. Sources, distribution and variability of airborne trace metals in La Plata City area, Argentina. Environ. Pollut. 2001; 111:149-158.
- Enzler SM. “Environmental Effect of War”. Water Treatment and Purification. Lenntech.
- Jazib J. Basics of Environmental Sciences. 2018; 162-264.
- Open briefing – Intelligence briefing Reducing the Supply of Weapons of Boko Haram. 2015.
- Gilbert FK, Kenneth JG. Thermodynamics of Explosives. 1985.
- Pricopi M. Tactics used by the Terrorists Organization of Boko Haram. Scientific bulletin. 2016 21(1): 41.
- Sexena MM. Environmental Analysis of Water, Soil and Air. Agro Botanical Publishers India. 1990.