Environmental factors controlling the distribution of magnetic mineral-forming bacteria in deep sea sediments
2 School of Oceanography, Oregon State University, USA
3 Integrated Ocean Drilling Program, Texas A&M University, USA
Received: 18-Dec-2017 Accepted Date: Dec 27, 2017; Published: 30-Dec-2017
Citation: Lund SP, Schwartz M, Berelson W, et al. Environmental factors controlling the distribution of magnetic-mineral-forming bacteria in deep sea sediments. J Mar Microbiol. 2017;1(1):11-19.
This open-access article is distributed under the terms of the Creative Commons Attribution Non-Commercial License (CC BY-NC) (http://creativecommons.org/licenses/by-nc/4.0/), which permits reuse, distribution and reproduction of the article, provided that the original work is properly cited and the reuse is restricted to noncommercial purposes. For commercial reuse, contact reprints@pulsus.com
Abstract
This paper presents new evidence for the widespread occurrence and placement of multiple zones of magnetic bacteria (MB) in Holocene deepsea sediments from the Blake/Bahama Outer Ridge (western North Atlantic Ocean) and the microenvironmental factors (primarily ambient geochemical gradients) that control their distributions. Our data come from reanalysis of rock magnetic data from Schwartz et al. that first identified the presence of MB in this region and new rock magnetic, geochemical, and geobiological measurements on previously studied cores and two new cores. All of our results are consistent with the work of Schwartz et al., but provide a more detailed assessment of the MB and the environmental factors controlling their placement. We find that the MB are distributed in four distinct zones (A-D) within Holocene sediments of the Blake-Bahama Outer Ridge. These four zones are traceable over a region greater than 104 km2 in extent within sediments deposited between 3000-4600 m water depth. The four zones are all relatively narrow (<20 cm thick) with no evidence for significant stratigraphic migration over time. Two zones appear to be causally related to solid-phase peaks in Mn (Zone C) and Fe (Zone D) concentrations that we associate with either current or relict Mn and Fe redox boundaries. Zones A and B lie above these two redox boundaries. None of these zones are synchronous on a regional scale, suggesting that geochemical horizons rather than external time-varying environmental factors control their placement. Different MB morphotypes dominate individual zones; rectangular/cubic forms dominate Zones A and C, while hexagonal/teardrop forms dominate Zones B and D. Both magnetotactic and dissimilatory MB occur in all four zones. Rock magnetic data suggest that magnetosome chains or lysed chains are present in at least Zones A, B, and C. We think the presence of chains is an indicator that the MB were alive when the cores were collected. Although we cannot be sure which of the MB zones represent current environmental conditions (pore water chemistry) versus relict conditions from earlier in the Holocene, the four zones appear to be related to the present and/or past geochemical gradients and thus may serve as paleo-indicators of specific diagenetic regimes.
Keywords
Magnetic bacteria; Deep-sea sediments; Organic flux; organic carbon; Satellite images; Holocene
Introduction
Bacteria are generally ubiquitous in deep-sea sediments, but it is likely that species or morphotypes have more restricted distributions that reflect environmental constraints or opportunities. These constraints permit stable communities of specific bacterial types to develop in particular microenvironments. One set of challenges is to develop measurement techniques that determine the presence (ambient or relict) of specific bacterial species/morphotypes in deep-sea sediments, their concentration and habitat range, and environmental factors that controled their habitat. It is only through field studies that we can realistically assess both the composition and relationships within individual bacterial communities as well as the exact environmental factors, which control their distribution.
One notable, and more easily identifiable, group of bacteria are magnetic-mineral- forming bacteria (MB), termed magnetogenic bacteria by Stolz [1,2]. MB are distinctive in deep-sea sediments because they form stable magnetic minerals either internally (magnetotactic bacteria) or externally (dissimilatory magnetic bacteria). Both types have distinctive rock magnetic properties and crystal forms/sizes that may be discernable from other (inorganically derived) magnetic phases in their surrounding sediments. A large number of laboratory studies [3,4] have documented that MB are normally associated with microaerobic geochemical redox boundaries and have estimated the specific geochemical conditions where certain specific MB types grow. But, there have been very few studies of MB in deep-sea sediments [1,5-7] which attempt to identify specific MB habitats and estimate both the MB distribution and the environmental factors that control their presence. Such field studies are necessary to test laboratory studies of MB ecology. This paper presents new evidence for widespread occurrence and placement of multiple MB zones in surficial deep-sea sediments from the Blake/Bahama Outer Ridge (BBOR, western North Atlantic Ocean) and the micro-environmental factors (primarily ambient geochemical gradients) that control the MB distributions.
Previous Field Studies
Karlin et al. [5] were perhaps the first to note a thin (~10 cm thick) layer with anomalous rock magnetic characteristics in surficial sediments of a deep-sea core from the Equatorial Pacific Ocean, which they interpreted to indicate the presence of MB. The layer, located at a depth of ~25 cm, was interpreted to reside at the transition between pore-water iron (Fe)-oxidizing and Fereducing conditions, based on distinctive sediment color changes.
Petermann and Bleil [6] were the first to extract living MB from boxcored deep-sea sediments on shipboard and estimate their concentration stratigraphically. They studied more than 25 box cores to identify a thin (~5 cm thick) layer of MB at 5-10 cm sediment depth in a large region of the Atlantic Ocean bottom adjacent to the African continental margin. Pore-water geochemistry (oxygen - O2, nitrate - NO3) indicated that their MB layer also resided at the boundary between Fe-oxidizing and Fe-reducing conditions and the base of the nitrate pore-water zone.
Hesse [7] noted a distinctive cyclicity in rock magnetic properties associated with glacial versus interglacial sediments in a deep-sea sediment core from the Tasman Sea. He interpreted the cyclicity to result from two different sedimentary environments, both containing MB, alternating in the sediment column. Hesse [7] extracted magnetic separates from the sediments at 29 horizons and used transmission-electron microscopy (TEM) to identify the presence of magnetosomes (~0.1 micron (m) crystals of magnetic material grown inside magnetotactic bacteria) and estimate their concentration and range of crystal morphologies (morphotypes). He identified two different communities of MB, one dominated by more equant magnetosome morphotypes and the other dominated by more elongate morphotypes, which he interpreted to replace one another ecologically as ocean bottomwater conditions changed from more oxic (equant) to less oxic (elongate). However, his results were not able to specifically comment on the exact relationships between extant MB communities and ambient geochemical conditions at any particular time.
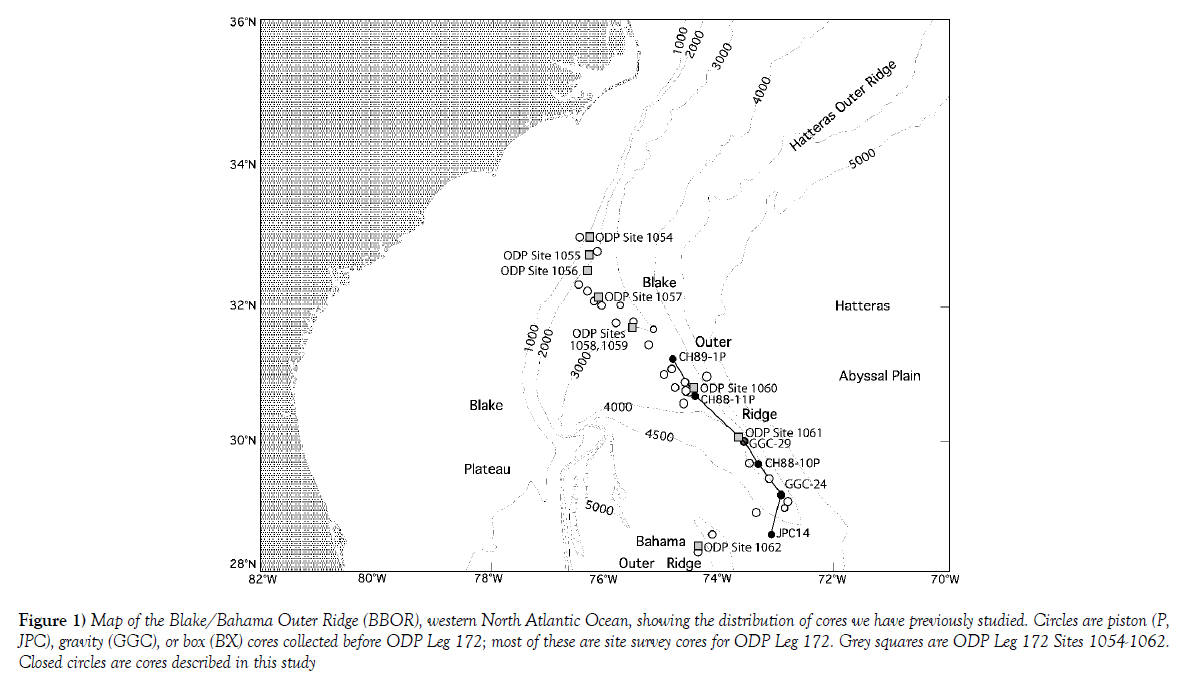
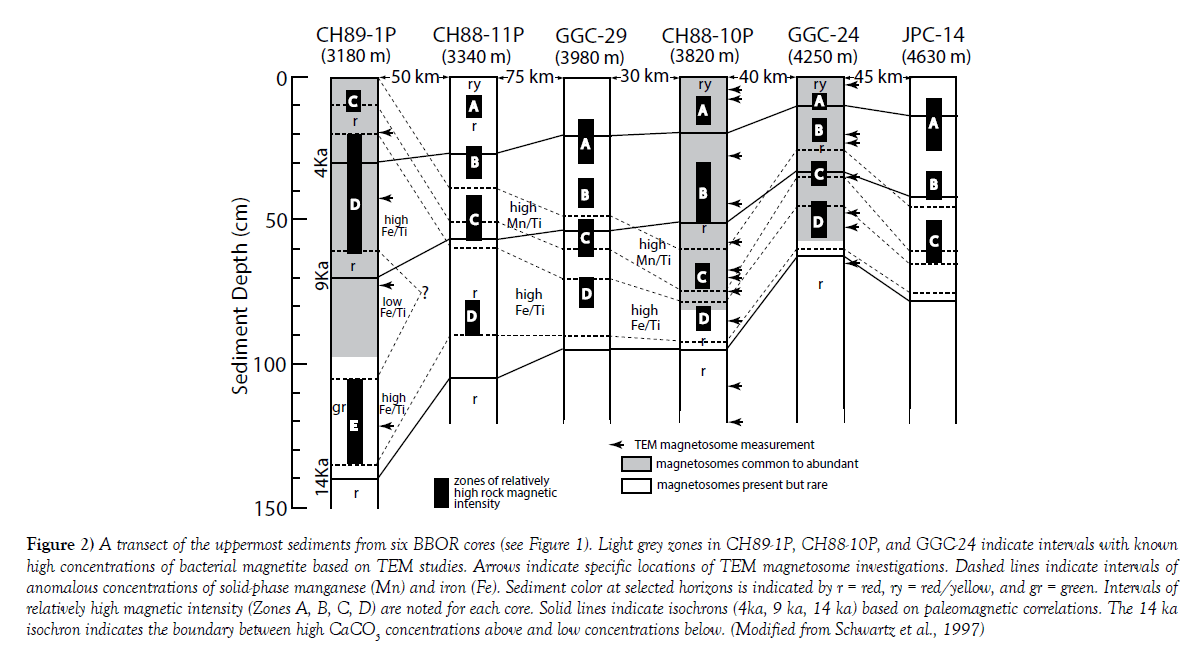
We have previously studied a transect of four deep-sea sediment cores from the BBOR (Figure 1), western North Atlantic Ocean, and identified a distinctive interval of MB in the surface sediments [1]. Our rock magnetic measurements suggested that MB were present in the surface sediments and TEM measurements of 22 magnetic separates from three of the cores (CH89-1P, CH88-10P, GGC-24) identified the presence of MB magnetite magnetosomes and estimated their concentration stratigraphically (Figure 2). The MB interval was located in the uppermost 60-90 cm of the cores, a much thicker layer than noted in the Karlin et al. [5] and Petermann and Bleil [6] studies. Solid-phase chemical analysis was used to estimate the locations of the manganese (Mn) and Fe oxide distributions and associated redox boundaries in the same cores; the MB were found in a layer occurring at and above the Fe-oxide boundary. Whether the solid-phase chemistry is a proxy estimate of ambient or relict pore-water chemistry is one of the questions we address here. Notable differences in the stratigraphic thickness and location of the Mn and Fe redox boundaries at each core site were attributed by Schwartz et al. [1] to varying environmental conditions along the BBOR.
Figure 1) Map of the Blake/Bahama Outer Ridge (BBOR), western North Atlantic Ocean, showing the distribution of cores we have previously studied. Circles are piston (P, JPC), gravity (GGC), or box (BX) cores collected before ODP Leg 172; most of these are site survey cores for ODP Leg 172. Grey squares are ODP Leg 172 Sites 1054-1062. Closed circles are cores described in this study
Figure 2) A transect of the uppermost sediments from six BBOR cores (see Figure 1). Light grey zones in CH89-1P, CH88-10P, and GGC-24 indicate intervals with known high concentrations of bacterial magnetite based on TEM studies. Arrows indicate specific locations of TEM magnetosome investigations. Dashed lines indicate intervals of anomalous concentrations of solid-phase manganese (Mn) and iron (Fe). Sediment color at selected horizons is indicated by r = red, ry = red/yellow, and gr = green. Intervals of relatively high magnetic intensity (Zones A, B, C, D) are noted for each core. Solid lines indicate isochrons (4ka, 9 ka, 14 ka) based on paleomagnetic correlations. The 14 ka isochron indicates the boundary between high CaCO3 concentrations above and low concentrations below. (Modified from Schwartz et al., 1997)
We have now reanalyzed our rock magnetic data from the cores studied by Schwartz et al. [1] and carried out new types of rock magnetic and geobiological measurements on the same cores and two new cores (GGC-29 and JPC-14). We believe that the reason why the MB layer in these cores was interpreted to be so thick is because there are actually four separate and discernable zones with distinctive rock magnetic properties. We hypothesize that these four zones are due to the presence of four separate MB communities. These four zones may indicate distinct MB communities that are coexisting today and located at different redox boundaries, but some of them may be relict communities that existed earlier in the Holocene. We present below detailed rock magnetic, geochemical, and geobiological measurements, which better delineate these four distinctive zones and their distribution on the BBOR. We also present a more detailed overview of micro-environmental conditions, especially geochemical factors, which we think control the different micro-ecological settings. This is the first time that the presence of multiple, potentially extant, MB zones has been identified in natural deep-sea sediments. We think that these sediments provide an ideal natural laboratory to field-test laboratory concepts of the relationships between geochemical gradients and MB habitats.
Blake/Bahama Outer Ridge (BBOR) Sedimentation Processes
The BBOR is a complex submarine topographic high, which extends southeastward from the North American continental margin more than 700 km into the western North Atlantic Ocean (Figure 1). The BBOR forms a natural barrier to the Western Boundary Undercurrent (WBUC), which is a relatively fast contour current flowing southward along the western boundary of the North Atlantic Ocean [8-10]. As the WBUC flows over and around the BBOR at depths of 2500-5000 m [11], it slows down, creating a sedimentary drift deposit with bulk accumulation rates of 10-60 cm/kyr [12-14]. Over the last 14,000 years, sedimentation rates have declined by 20-60%.
Sedimentary analyses [12,11,14] document that the BBOR sediments are typically hemipelagic clayey silts, dark gray to green in color, with mean grain sizes near 3-6 m. The sediments also contain 5% to 60% calcium carbonate and 0.5% to 2% organic carbon. Carbonate and organic percentages are high during interglacial conditions (such as the Holocene - today) and low during glacial conditions; most of the carbonate variability is due to dilution by clastic detritus carried by the WBUC. The organic flux to the ocean bottom along the BBOR varies systematically with higher values occurring near the coastline in relatively shallow water and lower values occurring at more distal (and deeper) sites.
We have studied more than 70 piston, gravity, and box cores from the BBOR (Figure 1), most collected in collaboration with Lloyd Keigwin (WHOI) and Tom Johnson (U of Minnesota-Duluth). Lund has also participated in ODP Leg 172, which drilled 9 sites (Sites 1054-1062, Figure 1) along this same BBOR transect [15]. The overall purpose of these studies was to estimate paleoceanographic, paleoenvironmental, and paleomagnetic variability in this region for the last ~200,000 years. It is this database of cores that led to our previous study of MB [1] and is the basis for our new measurements.
Assessing BBOR Geochemical Conditions
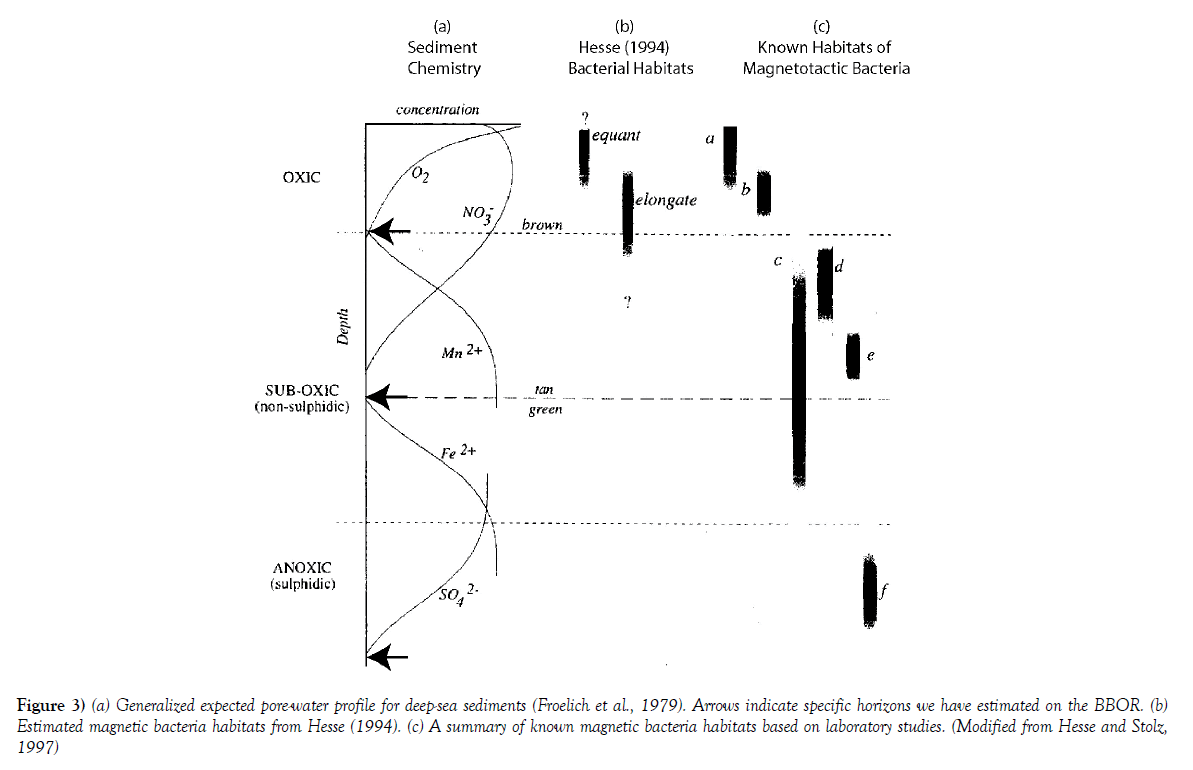
The overall abundance of MB in deep-sea sediments must depend on the availability of organic matter, soluble iron, and oxygen or reducible oxygen (manganese oxides, iron oxides, nitrate or sulfate) in the sediment column. In general, we expect deep-sea sediments to have a stratification of porewater geochemical signatures [16] as shown in Figure 3a. The pattern of diagenetic zonation follows the paradigm of free energy partitioning for electron acceptors, given oxidizable organic matter is available. The sequence of oxidants, progressing from oxygen, nitrate, Mn and Fe oxides to sulfate is based on the energy available by oxidizing one unit (mole) of organic carbon, yet the amount and quality of organic carbon is very likely to change down core, thus the distribution of oxidant use can scale very differently than is depicted in this schematic.
Figure 3) (a) Generalized expected pore-water profile for deep-sea sediments (Froelich et al., 1979). Arrows indicate specific horizons we have estimated on the BBOR. (b) Estimated magnetic bacteria habitats from Hesse (1994). (c) A summary of known magnetic bacteria habitats based on laboratory studies. (Modified from Hesse and Stolz, 1997)
Bacteria might be expected to first use oxygen to break down organic matter, followed by nitrate and metal oxides and then sulfate. We have previously delineated three stratigraphic horizons in BBOR sediments that may relate to this generic pore-water profile: (1) the base of dissolved O2 and onset of dissolved Mn2+, (2) the base of dissolved NO3- and onset of dissolved Fe2+, and (3) the base of dissolved SO42-, all indicated by arrows at left in Figure 3b. We have estimated the locations of these three horizons in a transect of the BBOR using a combination of published pore-water geochemical measurements [15] and both published [1] and new solid-phase geochemical measurements, which we use as proxy evidence for ambient pore-water conditions.
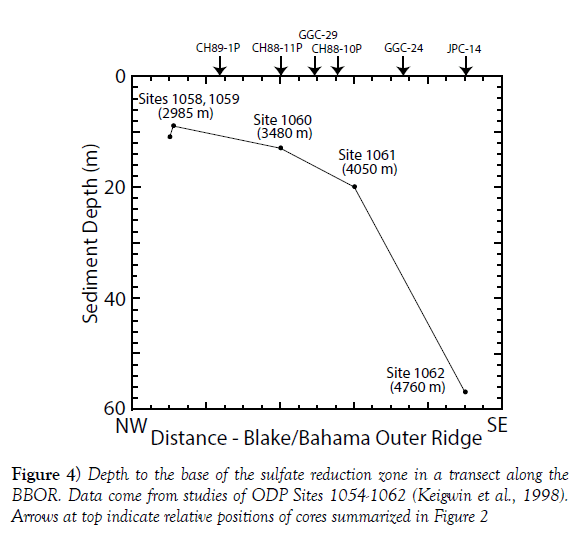
Pore-water geochemistry was carried out in a transect of the BBOR as part of ODP Leg 172 (Sites 1054-1062, Figure 1) with stratigraphic sample spacing of several meters. The base of the ambient sulfate pore-water (Figure 3), bottom arrow at left) at sites 1058-1062, which bracket our study cores, is mapped in (Figure 4). The sulfate reducing zone extends to depths from ~10 to ~60 meters. This sulfate penetration depth is likely due to changing sedimentation rates [17,18] and changes in organic flux, both of which generally decrease with increasing distance SE from the North American continental margin. The deepest sulfate penetration depth at site JPC-14 (Figure 4), farthest from the continental margin, implies a slower rate of Corg oxidation via sulfate reduction and the ultimate sink of sulfate at depth is probably anaerobic oxidation of methane, diffusing up from various sources deeper in the sediment column [19].
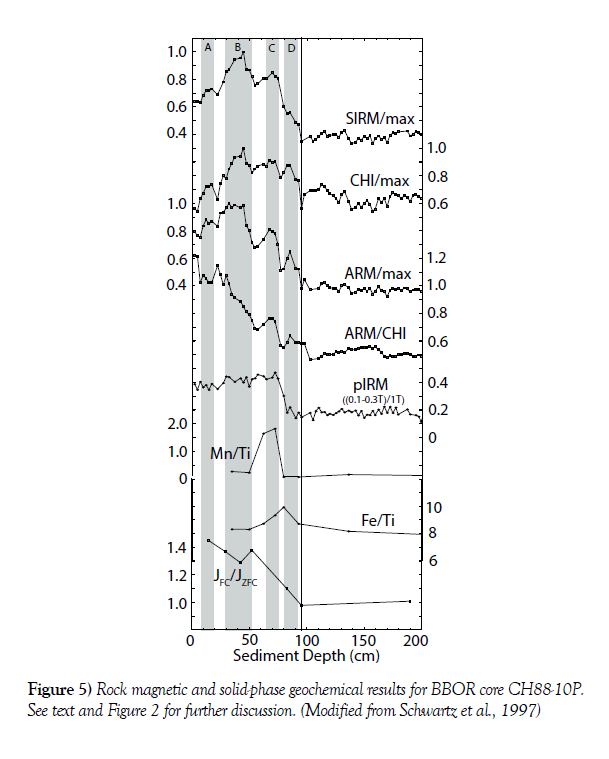
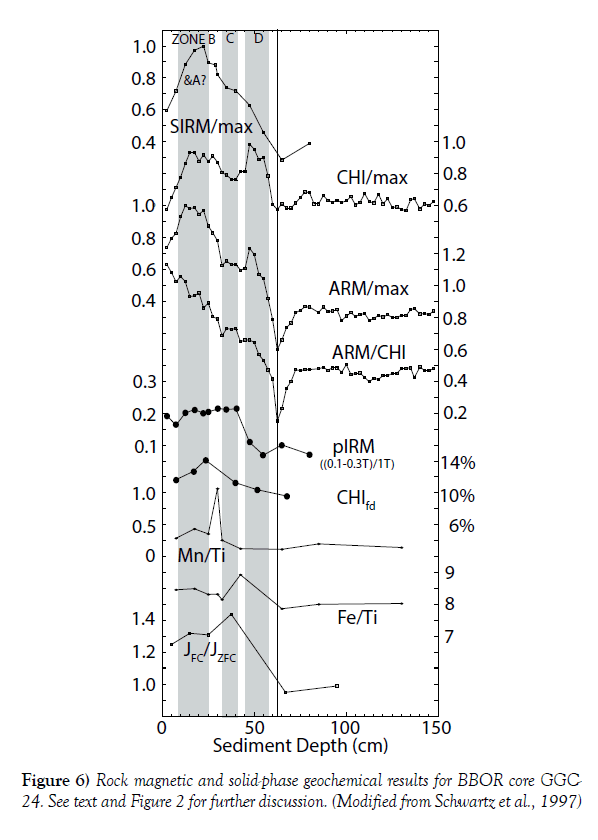
Solid-phase geochemistry (x-ray fluorescence) was measured in a transect of four BBOR piston or gravity cores (Figures 2, 5 and 6) by Schwartz et al. [1]. The stratigraphic sampling interval in each core was typically 5-20 cm and limited to the uppermost 1.5 m. Solid-phase manganese (MnO2) (normalized to Ti, an element representative of the overall clastic concentration) is present in the surface sediments of all cores, but is significantly depleted at depths below 10-60 cm due presumably to MnO2 dissolution (Figure 3, uppermost arrow at left). The MnO2 concentration peak forms when soluble Mn2+ is mobilized below this horizon and diffuses upward where it is precipitated at the base of the oxygen zone (Figure 3). This creates a solid-phase Mn peak (Figure 2) that is attributed to the diagenetic cycle of reduction and oxidation. A similar Fe peak (high Fe/Ti) is noted in each of the cores below the Mn spike (Figure 2). The Fe peak is due presumably to dissolution of selected Fe oxides (preferentially fine-grained ferric oxides like Fe2O3 or ferric oxyhydroxides like FeOOH) at greater depths and diffusion of Fe2+ upward to where it precipitates as ferric oxides or ferric oxyhydroxides at the base of the nitrate reduction zone (Figure 3, middle arrow at left). A second, lower Fe peak is notable in core CH89-1P alone; the significance of this will be discussed later. Together, the solid-phase geochemical profiles presumably estimate the boundary between O2 and soluble Mn2+ and the boundary between nitrate and soluble Fe2+ (Figure 3).
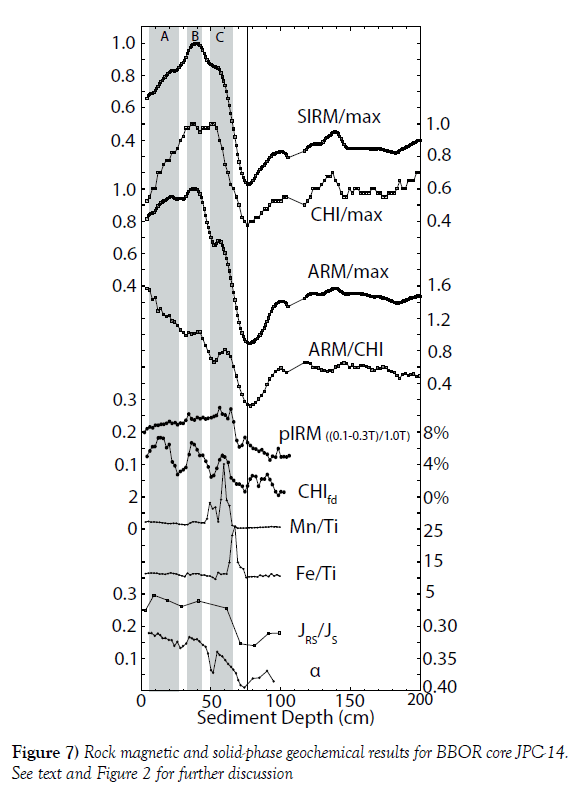
We have also used plasma optical emission spectroscopy (ICP-OES) to measure the solid-phase geochemistry on one new core - JPC14, which is located 45 km southeast of GGC24 (Figures 1, 2 and 7). These analyses were conducted every one cm in the uppermost 1 m of JPC-14. There is a notable Mn/Ti peak at 50-60 cm and a notable Fe/Ti peak centered at 70 cm (Figure 2). Their placement is consistent with, but more detailed than, the earlier data of Schwartz et al. [1]. Shoaling of the excess Mn peak (Figure 2) in a traverse from SE (deeper water) to NW (shallower water) is generally consistent with shoaling of the sulfate/methane horizon (Figure 4) indicating the trend toward higher sediment and organic fluxes.
Unfortunately, there are no detailed pore-water geochemical studies of Holocene sediments from the BBOR to verify our presumed relationship between pore-water Mn and Fe redox boundaries and our observed Mn and Fe solid-phase peaks. If the solid-phase Mn peak in all of the BBOR sediments is forming at present, its location down core should represent the depth of oxygen penetration, for example, 60-70 cm at JPC-14 and 25-35 cm at GGC-24. The first order controls on oxygen penetration in sediments, assuming diffusion is more important than bio-irrigation or advection, are bottom-water oxygen concentration and Corg rain rate. Cai and Reimers [20] and Cai and Sayles [21] developed a model that predicts oxygen penetration depth from these two parameters with the assumption that virtually all of the Corg arriving on the sea floor is oxidized by oxygen.
We have used this relationship to predict that oxygen penetration at the JPC-14 site should be shallower than 20 cm. This calculation was based on a delivery of Corg to the sea floor of 0.2 mmol Corg m-2 day-1 and bottom water oxygen of 250 μM. The flux of Corg to the BBOR is not constrained by sediment trap data nor have we found pore water data describing oxygen penetration depths. However, a long-term sediment trapping program on the Bermuda rise [22,23] constrains Corg rain rates to ~0.2 mmol Corg m-2 day-1; this represents an average of more than two decades of trapping. We don’t think the rain of Corg to the sea floor at the BBOR should be less than this value. Satellite images of chlorophyll, which have been transformed into predictions of Corg export, suggest higher Corg production around the BBOR compared to the Bermuda Rise. Inverse models built around the distribution of water column oxygen and TCO2 concentrations also predict higher Corg export around the BBOR compared to the Bermuda Rise [24]. If this oxygen penetration model is reasonable, it suggests that modern pore water Mn and Fe redox boundaries should occur much higher in the sediment column of our cores than observed. This suggests that the observed solid-phase Mn and Fe peaks are relict, having formed earlier in the Holocene.
A second argument that the solid phase Mn and Fe peaks are relict relative to modern diagenetic processes is their close spatial placement. In cores JPC-14, GGC-24 and CH88-10P the distance between the Fe and Mn peaks is <15 cm (Figure 2). The standard interpretation for the sequence of Fe and Mn peaks formed under diagenetic forcing is that the Mn peak forms at the Mn(II)- oxygen horizon (Figure 3a, top arrow) and the Fe peak forms at the Fe(II)- nitrate horizon (Figure 3a – middle arrow). Although this is a generalization, there are many examples in modern sediments demonstrating this pattern [24,25]. The modeling work of Golloway and Bender [26] have shown that the zone of nitrate penetration will extend far deeper (10’s of cm) beyond the zone of oxygen penetration under conditions where the zone of oxygen penetration exceeds 15 cm. The close association of the Fe and Mn solid phase peaks suggest they were formed at a time when oxygen penetration was not 10’s of cm deep, as would be required if they are modern features. It is therefore likely that the solid-phase Mn and Fe peaks represent relict times when the Mn and Fe redox boundaries were in those positions and that the ambient Mn and Fe redox boundaries are today higher in the sediment column and not associated with appreciable sold-phase Mn and Fe peaks.
If the solid-phase Mn and Fe peaks do not represent the modern redox boundaries, questions arise such as ‘why do they persist?’ and ‘where are the modern Mn or Fe oxide peaks?’ We don’t have definitive answers to these questions but both are likely related to the rate at which environmental conditions change and the rate at which diagenetic reactions occur [27]. The mobilization of a relict Mn or Fe oxide peak requires an available reductant, typically Corg. If the amount and reactivity of the Corg present in the sediments containing the Mn and Fe peaks are low, the rate of metal remobilization will be low, and the peaks will persist.
Reanalysis of the Schwartz et al. (1997) Rock Magnetic Data
Most of the piston and gravity cores noted in Figure 1 were collected together during a site survey cruise for ODP Leg 172. Shipboard magnetic susceptibility measurements of the cores were the first indication that many of the cores were anomalous in their rock magnetic characteristics. We expected the uppermost interglacial (Holocene) sediments, typically 1 m thick with ~50% carbonate, to have significantly lower magnetic susceptibility than the more clastic-rich glacial sediments with only about ~5% carbonate. Many of the cores, however, had significantly higher magnetic susceptibility in the Holocene surface sediments than they did in the underlying glacial sediments. We carried out detailed rock magnetic studies on four cores (CH88-10P, CH88-11P, CH89-1P, GGC24) from the BBOR in order to better understand the processes that produced high magnetic susceptibility (CHI) values in Holocene sediments. The rock magnetic results for cores CH88-10P and GGC24 are shown in (Figures 5-6) [1]. The results for CH89-1P are shown in Schwartz et al. [1] and the results for CH88-11P are consistent with CH88-10P.
Schwartz et al. [1] noted that high values of anhysteretic (ARM) and saturation-isothermal (SIRM) remanent magnetization generally occurred in the same intervals of high CHI, which indicated that there are anomalously high concentrations of remanent magnetic material in the surface sediments. ARM, SIRM, and CHI all increased by about 50% in the uppermost 50 cm or so of the sediment column, exhibited one to three peaks in intensity, then decreased to less than their surface values at depths of 100-150 cm and remain fairly constant for the next two to four meters. High sediment magnetic intensities correlated with high carbonate content (Holocene, Stage 1), the transitions to lower intensities correlated with the transition from high to low carbonate (Stage 1/2 boundary, solid lines in Figures 2 and 5-7), and intervals of lower, more constant intensities correlate with low carbonate sediments of Stage 2 (glacial). The initial rise in ARM, SIRM, and CHI values below the sediment/water interface is natural and is not an artifact of higher water content nearest the sediment/water interface. (All cores were sampled one to three years after core recovery and all surface samples have similar densities). Other sediment magnetic parameters associated with the carbonate-rich surface sediments included high values of the ‘S’ parameter - S0.3 (-IRM-0.3T/SIRM) [28] and ARM/CHI. Altogether, Schwartz et al. [1] argued that these measurements are most consistent with a broad zone of single-domain bacterial magnetite and verified that by TEM studies of magnetic separates, which identified plentiful magnetite magnetosomes (see discussion below).
We have now reanalyzed this rock magnetic data to more carefully assess the conclusions of Schwartz et al. [1]. We now think that we can discern four separate zones in the Holocene surface sediments, each with a peak in rock magnetic intensities (Figure 2) and distinctive rock magnetic properties, which are traceable among the four originally studied cores. We label these four zones A-D in figures (Figure 2, 5 and 6). We see evidence from several rock magnetic proxies to suspect that MB preferentially exist within these zones.
New Rock Magnetic Measurements
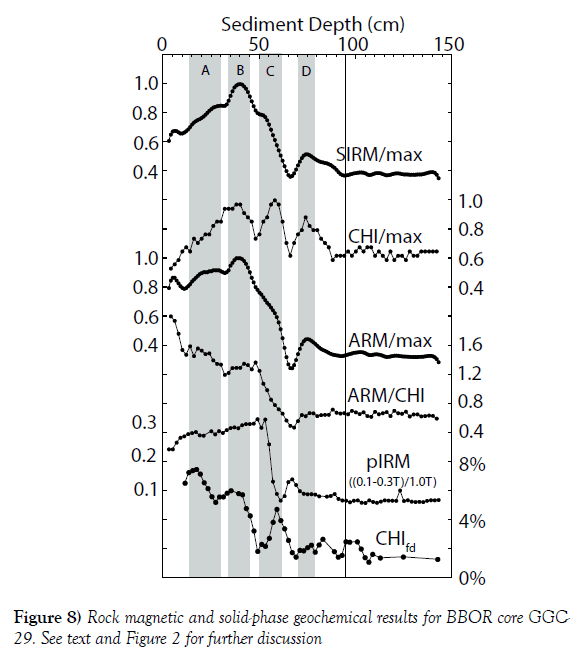
We have also made new rock magnetic measurements on cores JPC14 and GGC29 (Figures 1 and 2) to further corroborate our new hypothesis. These data, which are summarized in Figures 7 and 8, are completely consistent with the patterns in Figures 5 and 6 and helped convince us even more that we do have a predictable and reproducible rock magnetic pattern in the BBOR.
All four zones (A-D) have the following three rock magnetic characteristics that we think indicate the presence of anomalous concentrations of MB:
(1) - They are associated with localized relative intensity highs in ARM, SIRM, and Chi.
(2) - They normally have localized highs in the ARM/Chi ratio (normally an indicator of relatively fine magnetic grain size).
(3) - Schwartz et al. [1] noted that Zone B is associated with notable (5%- 8%) frequency-dependence of susceptibility (Chifd) in core GGC-24 (Figure 6). We now find clear evidence for relative highs in Chifd in JPC-14 and GGC-29 associated with all four zones (Figures 7 and 8). High frequencydependence in Chi is associated with superparamagnetic grains. Since Chi is almost certainly controlled by magnetite in these cores, that suggests anomalous concentrations of superparamagnetic magnetite, which we associate with dissimilatory MB.
We also note four other rock magnetic characteristics that we think identify the presence of anomalous MB concentrations:
(4) - Schwartz et al. [1] noted that the ‘S’ parameter - S0.3 (-IRM0.3T/SIRM) was anomalously high in the surface sediments. We have refined that by looking at a related IRM parameter that we call pIRM. It is the proportion of IRM acquired between 0.1T and 0.3T normalized to the SIRM. This indicates remanent magnetic grains with coercivities stronger than normal detrital magnetite, but not as high as ferric iron oxide phases (goethite/ hematite). It could include a small proportion of hematite or goethite, but because of the 1000-fold higher remanence per unit volume in magnetite versus hematite or goethite, we think it largely indicates single-domain magnetite, which we think is of bacterial origin. pIRM is anomalously high in zones A-C, and actually appears to be rising to a peak in zone C, below which it drops precipitously and is low in zone D.
(5) – Moskowitz et al. [29] have developed a new technique to study bacterial magnetite, which they [30] tested on two of our study cores (CH88-10P and GGC24). The technique appears to test whether single-domain magnetite crystals are dispersed or in chains. The technique cycles magnetic material to low temperatures (~5K-20K) from room temperature and notes temperaturedependent magnetic properties in the presence of applied field and without applied fields. A ratio of magnetic intensity during cooling in field (JFC) versus cooling in the absence of field (JZFC), JFC/JZFC, has values near 1 if grains are independent and higher if they reside in chains. The ratios for selected horizons in our two cores are shown in Figures 5 and 6. This data is consistent with the pIRM data in its distribution and suggests that a significant percentage of magnetosomes in Zones A, B, and C reside in chains, which we interpret to indicate the presence of living MB at the time of core collection. (Zone D was not adequately sampled to evaluate its JFC/ JZFC characteristics.)
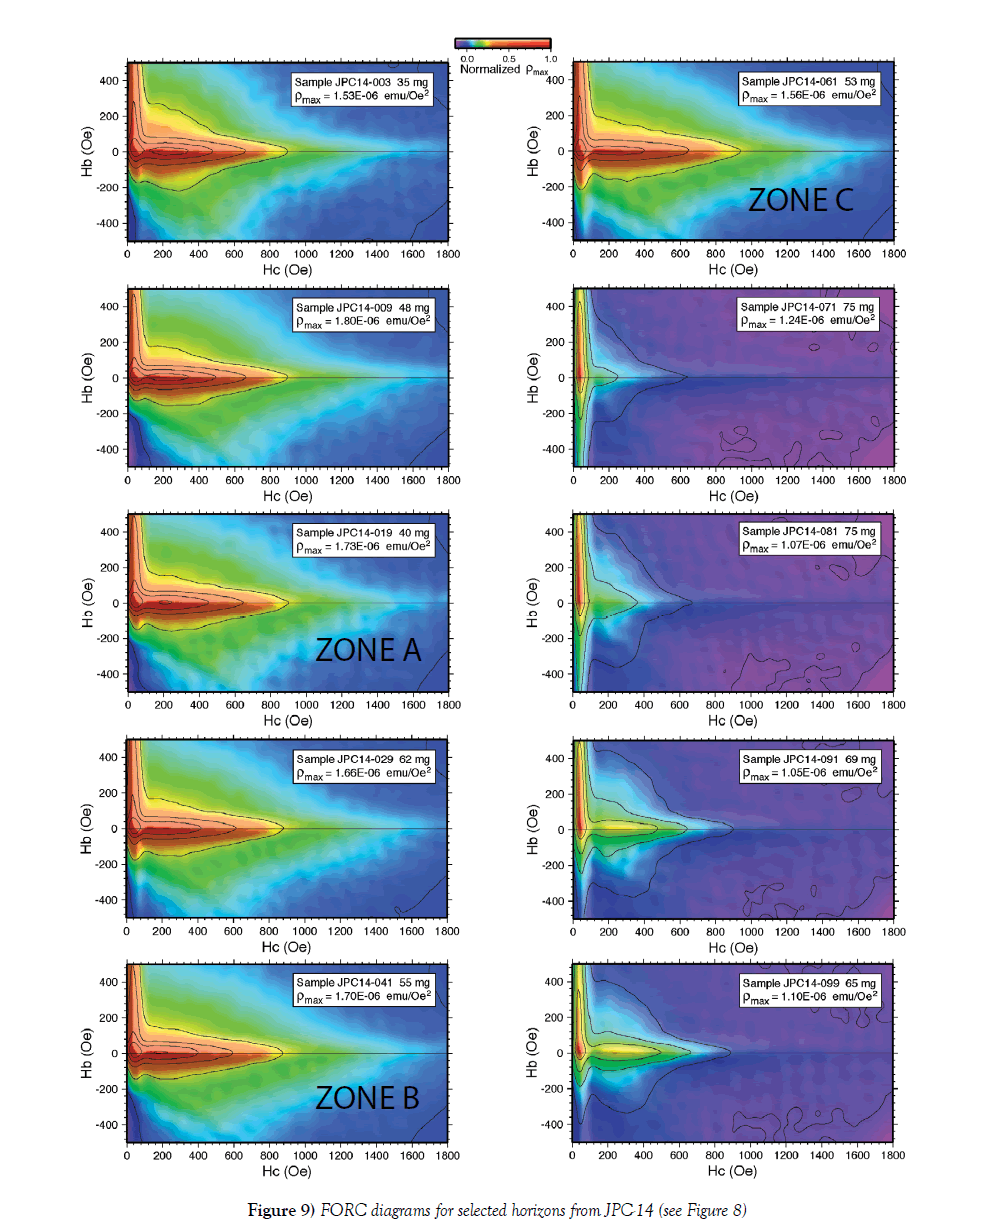
(6) - We have also carried out First-Order Reversal Curve (FORC) analysis [31-34] and hysteresis measurements on samples from JPC14. The Jrs/Js is consistent with the pIRM and JFC/JZFC curves. Ten actual FORC diagrams are shown in Figure 9. They clearly indicate a dramatic difference between the surface sediments and those that are Pleistocene in age. The most obvious feature in the FORC diagrams is the abrupt change in the coercivity distribution that occurs between the samples at 61 (JPC14-061) and 71 cm (JPC14-071) depth. The quasi-reversible ridge, which is the very low coercivity part of the FORC distribution that occurs along y-axis and on the far left side of the FORC diagrams, becomes dominant for samples from 71 cm depth and below. Because the FORC distributions are normalized, this change indicates a major loss of fine-grained magnetite with low interaction and intermediate-coercivity (15-100 mT or 150-1000 Oe) for the samples at 71 cm depth and deeper. The FORC diagrams below 71 cm also show a widening in the bias (Hb) between 15 to 50 mT (150 to 500 Oe), which indicates increased interactions for magnetic grains with these coercivities, which is typical of multi-domain magnetite grains [35].
(7) – We have carried out ferromagnetic resonance (FMR) spectroscopy measurements on JPC14 using a new methodology to assess magnetosome presence and evidence for chains [36-39] This methodology is highly sensitive to iron magnetic grain interactions and is another estimator of magnetite chain concentration Kopp et al. [37] have shown that samples dominated by MB in chains have values less than 0.25, MB in lyced chains have values <0.35, and while single-domain synthetic and dispersed magnetite samples have values > 0.4. Our results show values ~0.31 in Zones A and B, and values ~0.34 in Zone C. These results are shown in Figure 7 and are consistent with the JFC/JZFC measurements of Housen and Moskowitz [30].
The last three of the additional rock magnetic characteristics [5-7] all suggest that Zones A, B, and C have MB with intact magnetosome chains or lyced chains (Zone C) within them. This is our best evidence for living MB in Zones A, B, and perhaps C when the cores were collected. They also show some evidence for anomalously high MB concentrations within the three zones as do the first four rock magnetic characteristics, but less detailed sampling makes this observation more tentative. Also, the three additional rock magnetic characteristics do not show high values for zone D. We have no certain reason for that observation at this time.
Chronostratigraphy
The four zones of anomalously high magnetic intensity could be associated with synchronous changes in local environmental conditions along the Blake/Bahama Outer Ridge. To assess that, we have also measured the paleomagnetic secular variation (PSV) in all of the studied cores. We have previously published the expected Holocene PSV for this region [1,40,41] and we can correlate that pattern in all of our cores. We have plotted isochrons at 4000, 9000, and 14,000 calibrated Years BP in Figure 2, based on the paleomagnetic results from each core and correlations to our published results. It is apparent that the four zones of anomalously high intensity are not isochronous. Therefore, we do not think that these zones are due to external environmental factors.
New Geobiological Observations
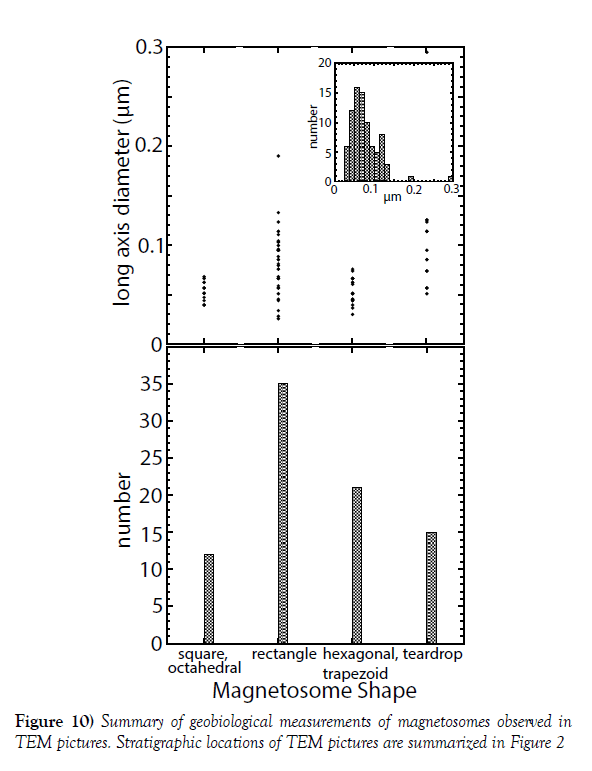
Schwartz et al. [1] took more than 50 TEM pictures in the process of estimating magnetosome concentration. The relative concentration of magnetosomes is summarized in Figure 2 [1]. We have now gone back to those pictures to more carefully assess magnetosome morphotypes (crystal shapes), stratigraphic placement, and magnetosome size. Some of these new measurements are summarized in Figure 10. We note a wide variety of euhedral crystal shapes in our TEM pictures: equant forms that are either square or octahedral in cross-section, slightly elongate rectangular forms, and more elongate forms that are trapezoidal or hexagonal in cross-section or teardrop in shape. We note a broad, overall bimodal distribution in magnetosome size (diameter of the visible cross-sectional long axis); equant or hexagonal forms are relatively small (~0.05 m) and have relatively narrow grain size ranges, while rectangular or teardrop forms are relatively large (mostly 0.1 m with a few examples as large as 0.3 m) and have distinctly broader grain size distributions. We interpret this to indicate the presence of several distinct MB morphotypes or species.
Most samples contain a mixture of different morphotypes with elongate forms being more common generally than equant forms. We do, however, note some evidence for selected morphotypes dominating in different stratigraphic levels. Zone A only contains square or rectangular forms (more equant). Zones B, C, and D contain all forms, but Zone C seems to be dominated by square and rectangular forms (as in Zone A), while Zones B and D are clearly dominated by teardrop and hexagonal forms (more elongate). The apparent dominance of square/rectangular (more equant) forms in Zone A versus dominance of hexagonal/teardrop forms (more elongate) in Zone B is consistent with the observations of Hesse [7] that equant MB forms dominated under more aerobic conditions (and closer to the sediment/water interface in our study) while more elongate MB forms dominated under more dysaerobic conditions (and deeper in the sediment column in our study). But, more systematic measurements are needed to verify these initial observations.
Hypothesized Microbial Ecology
We think that the four MB zones are systematic and correlatable over most of the BBOR (>104 km2). We hypothesize that these four zones are due to four separate communities of MB either all living at different sediment depths in the BBOR today or a combination of extant and relict communities. We believe that the geochemical redox conditions on the BBOR, which were broadly estimated above, have in the past and are at present controlling the locations of the four MB zones. There are, however, several unresolved questions relating to MB ecology that need to be assessed: 1) which of the MB zones are living communities versus relict communities, 2) what aspects of the geochemical variability is important for each MB zone, and 3) can the rock magnetic variability say anything about the distribution of MB in each MB zone.
1) Schwartz et al. [1] argued that magnetosomes were the cause of the anomalously high remanence intensities in the surface, carbonaterich sediments. But, the anomalous intensities and TEM studies only indicate the presence of magnetosomes, not whether they are located in living cells or as separate individual magnetosomes dispersed from dead MB. The JFC/JZFC technique developed by Moskowitz et al. [29] and discussed above is perhaps the best direct evidence we have for magnetosomes still residing in chains. The measurements of Housen and Moskowitz et al. [30] on two of our cores (Figures 5 and 6) suggest that a significant number of magnetosomes still reside in chains in Zones A, B, and C. Our FORC and FMR spectroscopy analyses on core JPC14 (Figure 7) are consistent with this assessment, although the FMR spectroscopy may indicate a higher proportion of lyced magnetsomes in Zone C versus Zones A and B. We think that these data indicate the presence of living MB in Zones A, B, and perhaps C at the time of core collection. Our data are not sufficient to comment on the possibility of magnetosome chains in Zone D.
2) We hypothesize that the four MB zones are located where they are because they take advantage of redox gradients within pore water associated with Mn+2 and Fe+2 diffusion (Figure 3a). However, it is also possible, if our solid-phase Mn and Fe peaks are relict, that the MB are using the solid-phase Mn and Fe oxides as electron acceptors. If this second process is important, then microbial life may also persist within deeper sediments and derive life-sustaining energy from the mediation of redox reactions involving these solid-phase oxides at depth. Our primary evidence for a metal-oxide influence on MB placement comes from the observation that the lower two MB zones, C and D, are located within and just below the solidphase Mn and Fe peaks in all cores, while the upper two MB zones lie in consistent positions above these two zones in all cores (Figure 2). Also, all four zones are located in positions consistent with the known habitats of selected cultured MB (Figure 3c). Zones A and B are located consistent with microaerobic conditions associated with nitrate reduction (above top arrow in Figure 3). These zones may not be noticeable in core CH89-1P because the nitrate interval in this core could be very narrow (<15 cm) and rock magnetic data close to the sediment/water interface in this piston core was not of the best quality. In CH89-1P, the iron reduction zone is very broad and there are two iron peaks. The upper peak is associated with zone D while the lower peak is associated with another zone with unusual rock magnetic properties, which we term zone E. Unfortunately, Zone E is not noted in any of the other cores and we find no geochemical anomaly associated with this zone. We propose that Zones A and B represent the location of modern Mn and Fe redox boundaries, which for various reasons have not built noticeable solid-phase Mn and Fe peaks, while Zones C and D represent relict versions of these same two communities, but perhaps still containing living MB. Our observed pattern of more equant (Zones A and C) versus more elongate (Zones B and D) MB communities is consistent with this hypothesis. It may be possible, however, as noted above, that Zones C and D are extant MB communities using the solid-phase Mn and Fe peaks to fuel organic matter oxidation. Other relationships, are however also possible, but without pore-water geochemistry, we cannot be certain which associations are causal.
3) We think that there is something to be learned about MB ecology based simply on the stratigraphic profile of rock magnetic intensities through the four zones. If MB were somewhat evenly distributed in the uppermost meter of sediment, we might expect to see a slow and monotonic increase in magnetic intensity going down-core due to a slow accumulation of magnetosomes from dead and lysed cells. If there are only narrow intervals with high concentrations of living MB, then we would note narrow intervals where intensity is higher, but we should also note higher intensities below the zones versus above the zones due to addition of dead MB and their products in the sediments that have passed through each MB zone. We think the second pattern is strikingly similar to our observed results for Zones A and B. There is a general trend of increasing remanent intensity and pIRM with increasing depth through Zones A and B in all cores. This is less obvious in Zone C and clearly not the case in Zone D. This may be another form of evidence that at least Zones A and B are living communities. However, it may be that Zones C and D are too close to the base of the Holocene and significant changes in the pattern of clastic and carbonate flux to let these patterns be visible. In either case, these observations are more consistent with the hypothesis of narrow distinct MB zones of living bacteria occurring in the Holocene BBOR sediments.
The shapes of the magnetic intensity peaks in each zone also may tell us about the distribution of MB as a community in the zone. The zones are all <20 cm wide (above baseline); this probably indicates the stratigraphic interval of the living communities. The shape of the peaks probably reflects the relative concentrations of MB in each zone. The shapes must all have developed below the interval of normal bioturbation (<8 cm) in the surface sediments and, thus, were unlikely to be significantly modified by such physical processes. The centers of the peaks are normally (in the cores with most detailed sampling) at the centers of the Mn/Ti and Fe/Ti solid phase metal peaks. This, again, indicates a causative relationship between Mn and Fe redox boundaries and the MB zones.
We have not said much about dissimilatory MB. Our only direct evidence for them is the frequency-dependent magnetic susceptibility (CHIfd) measurements. It is clear that such MB are concentrated in zones A, B, C, and D (Figures 6-8), just like magnetosome-bearing MB. However, the overall concentration of CHIfd appears to decrease with depth where we have measured it, unlike the pattern noted above for MB magnetosomes. It is not certain what causes this difference in trend.
CONCLUSION
We have reassessed the rock magnetic data of Schwartz et al. [42] to better understand the pattern of magnetic bacteria (MB) placement in surficial sediment of the Blake-Bahama Outer Ridge, western North Atlantic Ocean. We have made new rock magnetic, geochemical, and geobiological measurements on previously studied cores and two new cores. All of our results are consistent with the work of Schwartz et al. [43], but provide a more detailed assessment of the MB and the environmental factors controlling their placement.
We find that the MB are distributed in four distinct zones (A-D) within the Holocene sediments of the Blake-Bahama Outer Ridge. These four zones are traceable over a region greater than 104 km2 in extent. The four zones are all relatively narrow (~20 cm thick) and suggest a similarly narrow living range for each zone (MB assemblage) with no evidence for significant stratigraphic migration over time. Two zones appear to be causally related to solid-phase peaks in Mn (Zone C) and Fe (Zone D) that we associate with either active or relict Mn and Fe redox boundaries. Geochemical evidence suggests that zones C and D are well below the location expected for the zero oxygen and nitrate horizons, thus we speculate that MB are occupying a sediment horizon defined by relict metal oxide layers. MB Zones A and B lie above these two redox boundaries and follow their stratigraphic positions on a regional basis. We hypothesize that these two zones are related to active Mn and Fe porewater redox boundaries. None of these zones are synchronous on a regional scale, suggesting that geochemical horizons rather than external time-varying environmental factors control their placement.
We noted that different MB morphotypes dominate individual zones; rectangular/cubic forms dominate Zones A and C while hexagonal/teardrop forms dominate Zones B and D. This is consistent with our hypothesis that Zones A and C formed at active or relict Mn redox boundaries and that Zones B and D formed at active or relict Fe redox boundaries. Both magnetotactic and dissimilatory MB, as a community, occur in Zones A, B, C, and D. Rock magnetic data suggest that magnetosome chains are present in Zones A, B, and perhaps C, suggesting that these are extant MB communities.
Acknowledgements
Our research has received support from National Science Foundation grants EAR-0518322 (J. McManus).
REFERENCES
- Schwartz M, Lund SP, Hammond DE, et al. Early sediment diagenesis on the Blake/Bahama Outer Ridge and its effects on sediment magnetism. J Geophys Res. 1997;102:7903-14.
- Stolz J. Magnetosomes. J Gen Microbiol. 1993;139:1633-70.
- Blakemore R, Maratea D, Wolfe R. Isolation and pure culture of a freshwater magnetic spirillum in chemically defined medium. J Bact. 1979;140:720-29.
- Moench T. Bilophococcus magnetotacticus gen nov spec nov a motile magnetic coccus Antonie Van Leeuvenhoek. 1989;54:483-96.
- Karlin R, Lyle M, Heath G. Authigenic magnetite formation in suboxic marine sediments. Nature. 1987;326:490-93.
- Petermann H, Bleil U. Detection of live magnetotactic bacteria in South Atlantic deep-sea sediments. Earth Planet Sci Lett. 1993;117:223-228.
- Hesse P. Evidence for bacterial paleoecological origin of mineral magnetic cycles in oxic and sub-oxic Tasman Sea sediments. Mar Geol. 1994;117:1-17.
- Heezen BC, Hollister CD, Ruddiman WF. Shaping the continental rise by deep geostrophic contour currents. Science. 1966;152:502-8.
- Amos AF, Gordon AL, Schneider ED. Water masses and circulation patterns in the region of the Blake-Bahama Outer Ridge. Deep Sea Res. 1971;18:145-66.
- Hogg NG. A note on the deep circulation of the western North Atlantic: its nature and causes. Deep Sea Res. 1983;30:945-961.
- Haskell BJ. The influence of deep western North Atlantic circulation on the late Quaternary sedimentation of the Blake Outer Ridge unpublished Phd dissertation. Duke University. 1991.
- Johnson TC, Lynch EL, Showers WJ, et al. Pleistocene fluctuations in the Western Boundary Undercurrent on the Blake Outer Ridge. Paleocean. 1988;3:191-207.
- Keigwin L, Jones GA. Glacial-Holocene stratigraphy, chronology, and paleoceanographic observations on some North Atlantic sediment drifts. Deep Sea Res. 1989;36:845-67.
- Haskell BJ, Johnson TC, Showers WJ. Fluctuations in deep western North Atlantic circulation on the Blake Outer Ridge during the last deglaciation. Paleocean. 1991;6:291-312.
- Keigwin L, Rio D, Acton G, et al. Initial Results from ODP Leg 172 Ocean Drilling Program. College Station TX. 1998;172.
- Froelich PN, Klinkhammer GP, Bender ML, et al. Early oxidation of organic matter in pelagic sediments of the eastern equatorial Atlantic: suboxic diagenesis. Geochim Cosmochim Acta. 1979;43:1075-90.
- Berner RA. Sulfate reduction and the rate of deposition of marine sediments. Earth Planet Sci Letters. 1978;37:492-98.
- Paez-Osuna F, Osuna-Lopez JI. The initial gradient of sulfate in Gulf of California sediments J Sed Pet. 1990:60:912-917.
- Borowski WS, Paull CK, Ussler III W. Marine pore water sulfate profiles indicate in situ methane flux from underlying gas hydrate. Geology. 1996;24:655-58.
- Cai WJ, Reimers CE. Benthic oxygen flux, bottom water oxygen concentration and core top organic carbon content in the deep northeast Pacific Ocean. Deep-Sea Research. 1995;42:1681-99.
- Cai WJ, Sayles FL. Oxygen penetration depths and fluxes in marine sediments. Marine Chemistry. 1996;52:123-13.
- Deuser WG. Temporal variability of particle flux in the deep Sargasso Sea, in Particle Flux in the Ocean. 1995;185-98.
- Schlitzer R. Applying the adjoint method for biogeochemical modeling: Export of particulate organic matter in the world ocean, Inverse Methods in Global Biogeochemical Cycles, Geophysical Monograph. 2000;114:107-124.
- Thomson J, Carpenter MSN, Colley S, et al. Metal accumulation rates in northwest Atlantic pelagic sediments. Geochim Cosmochim Acta. 1984;48(10):1935-48.
- Thomson J, Higgs NC, Jarvis I, et al. The behaviour of manganese in Atlantic carbonate sediments. Geochim Cosmochim Acta. 1986;50(8):1807-18.
- Goloway F, Bender M. Diagenetic models of interstitial nitrate profiles in deep sea suboxic sediments. Limnol Oceanog. 1982;27(4):624-38.
- Burdige DJ, Gieskes JM. A porewater/solid phase diagenetic model for manganese in marine sediments. Am J Sci. 1983;283:29-47.
- King JW, Channell JET. Sediment magnetism, environmental magnetism and magnetostratigraphy. Rev Geophys Supplement. 1991;358-70.
- Moskowitz BM, Frankel RB, Bazylinski DA. Rock magnetic criteria for the detection of biogenic magnetite. Earth Planet Sci Lett. 1993;120(3-4):283-300.
- Housen B, Moskowitz B. Depth distribution of magnetofossils in near-surface sediments from the Blake/Bahama Outer Ridge, western North Atlantic Ocean, determined by low-temperature magnetism. J Geophys Res. 2006;111:G01005.
- Mayergoyz ID. Mathematical models of hysteresis. IEEE Trans Magn. 1986;606-8.
- Pike CR, Roberts AP, Verosub KL. Characterizing interactions in fine magnetic particle systems using first order reversal curves. J Appl Phys. 1999;85:6660-7.
- Acton G, Roth A, Verosub KL. Analyzing micromagnetic properties with FORCIT software. Eos. 2007;88:230.
- Acton G, Yin QZ, Verosub KL, et al. Micromagnetic coercivity distributions and interactions in chondrules with implications for paleointensities of the early Solar System. J Geophys Res. 2007;112(B3):1-19.
- Roberts AP, Pike CR, Verosub KL. First-order reversal curve diagrams: A new tool for characterizing magnetic properties of natural samples. J Geophys Res. 2000;105(B12):28461-75.
- Weiss BP, Kim SS, J. Kirscvink JL, et al. Ferromagnetic resonance and low-temperature magnetic tests for biogenic magnetite. Earth Planet Sci Lett. 2004;244(1-2):73-89.
- Kopp RE, Weiss BP, Maloof AC, et al. Chains, clumps, and strong’s: magnetofossil taphonomy with ferromagnetisc resonance spectroscopy. Earth Planet Sci Lett. 2006;247(1-2):10-25.
- Maloof AC, Kopp RE, Grotzinger JP, et al. Sedimentary iron cycling and the origin and preservation of magnetization in platform carbonate muds, Andros Island, Bahamas. Earth Planet Sci Lett. 2007;259(3-4):581-98.
- Fischer H, Mastrogiacomo G, Loffler J, et al. Ferromagnetic resonance and magnetic characteristics of intact magneotosome chains in Magnetospirillum gryphiswaldense. Earth Planet Sci Lett. 2008;270:200-8.
- Lund S, Keigwin L. Measurement of the degree of smoothing in sediment paleomagnetic secular variation records: an example from late Quaternary deep-sea sediments of the Bermuda Rise, western North Atlantic Ocean. Earth Planet Sci Lett. 1994;122:317-30.
- Lund S, Williams T, Acton G, et al. Brunhes Epoch magnetic field excursions recorded in ODP Leg 172 sediments, Proceedings of the Ocean Drilling Project. Scientific Results. 2001;172.
- Schwartz M, Lund SP, Johnson T. Environmental factors as complicating influences in the recovery of quantitative geomagnetic-field paleointensity estimates from sediments. Geophys Res Lett. 1996;23:2693-96.
- Schwartz M, Lund SP, Johnson TC. Geomagnetic field intensity from 12,000-71,000 years BP as recorded in deep sea sediments of the Blake Outer Ridge, North Atlantic Ocean. J Geophys Res. 1998;103:30407-416.


