Hippocampal volumetric variations in the normal human brain by magnetic resonance imaging (MRI)
Ismail R1,*, Eltomey M2, Mahdy A1 and Elkattan A1
1Department of Human Anatomy, Tanta University of Medical Sciences, Tanta, Egypt.
2Department of Radiology, Tanta University of Medical Sciences, Tanta, Egypt.
- *Corresponding Author:
- Dr. Radwa R Ismail
Department of Human Anatomy ,Tanta University of Medical Sciences, Tanta, Egypt.
Tel: 00201288740746
E-mail: dr_roda2010@yahoo.com
Citation: Ismail R, Eltomey M, Mahdy A, et al. Hippocampal volumetric variations in the normal human brain by magnetic resonance imaging (MRI). Int J Anat Var. 2017;10(3):33-6.
Copyright: This open-access article is distributed under the terms of the Creative Commons Attribution Non-Commercial License (CC BY-NC) (http://creativecommons.org/licenses/by-nc/4.0/), which permits reuse, distribution and reproduction of the article, provided that the original work is properly cited and the reuse is restricted to noncommercial purposes. For commercial reuse, contact reprints@pulsus.com
[ft_below_content] =>Keywords
Brain MRI; Age; Sex; Hippocampus
Introduction
The morphology and size of the human brain and its major anatomically defined subdivisions are very important for understanding neurological diseases and also for neurosurgery. The widespread use of high-resolution neuroimaging techniques began in the early 1990s, and since then, numerous studies have been undertaken that apply these techniques to the volume measurement of various brain structures.
Hippocampal volume (HCV) is well preserved throughout adulthood in men and women, with no significant correlation with age. HCV is affected by several neurodegenerative and psychiatric diseases. Alzheimer disease (AD) is the most common disorder associated with reduced hippocampal volume [1-3].
Subjects and Methods
Subjects
The study included 60 healthy patients, 28 males and 32 females, who had normal brain MRI study. These subjects were chosen from MRI scanning unit of radiology department in Tanta university hospital. Their ages ranged between 20 to 80 years (mean 47.1 ± 16). The main indication for the MRI studies was investigation of the cause of headache. Patients with positive neurological and imaging findings were excluded from the study. The study was performed between May, 2014 and March, 2015 and approved by the Ethics Committee of faculty of medicine.
The study subjects were further classified into three age groups as follows:
Group I: included 21 persons, 9 males and 12 females, their ages ranged between 20-39 years old.
Group II: included 22 persons; 11 males and 11 females, their ages ranged between 40-59 years old.
Group III: included 17 persons; 8 males and 9 females, their ages ranged between 60-80 years old.
Methods
MRI scanning machine
MRI scans were performed at the MRI scanning units in the Radiology Department at our institution. The machines used were the GE Signa 1.5T system (GE Medical systems, Wisconsin, USA) and Toshiba Titan Vantage 1.5T system (Toshiba Medical Systems, Japan).
MRI Processing
Magnetic resonance imaging (MRI) of the brain
Routine brain MRI protocol was performed, including axial (T1WI and T2WI), coronal PDWI and sagittal T1WI. A 3D T1WI sequence was performed with slice thickness 0.5 mm and slice spacing 0 mm. The study images were transferred into DICOM format to a personal computer (PC) workstation having 3D Slicer 4.3.3.1 software installed on it which is a multiplatform, free open source software package for visualization and medical image computing developed by Harvard University and approved for medical research (http://www.slicer.org/). The software helps in providing reliable morphometry of the structures of interest by manual and semiautomated methods. Studied structure is the hippocampus, Volumetric analysis was performed on the 3D T1-weighted images in axial and sagittal planes. Manual and semi-automated tracing of the structures of interest was done which allowed for volume calculation by summation the trace areas in the consecutive slices multiplied by the slice thickness. The total volumes were measured after manually tracing both the right and left side. The total intracranial volume was calculated and volumes of each region of interest were expressed as a percent of the intracranial volume. All volumes were described in cubic centimeters.
Delineation of the studied regions
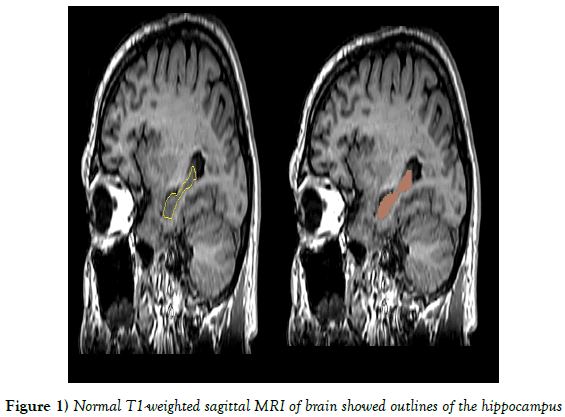
Delineation means drawing labels to define regions of interest within a brain using semi-automated. The volume of hippocampus was estimated from 30 sagittal slices. Hippocampus proper, the subicular complex, dentate gyrus, alveus, and hippocampal fimbria were included for measurement of hippocampal body and tail. Measurement excluded the amygdala, parahippocampal gyrus, isthmus of the cingulated gyrus, and the crus of fornix (Figure 1) [4].
Intracranial volume (ICV)
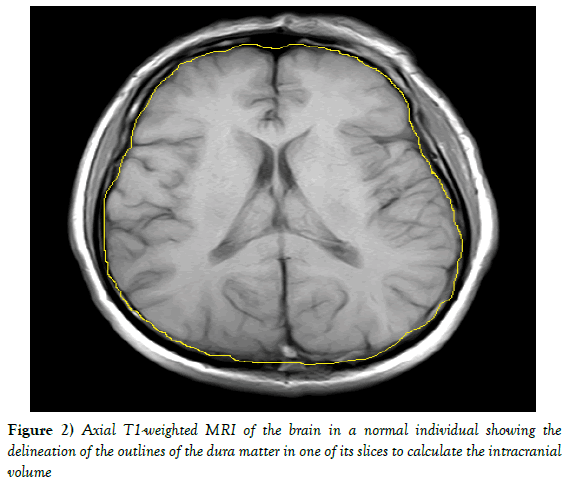
Intracranial volume was estimated using the T1WI MRI sequence with 30 axial slices (5 mm slice thickness, 2 mm gap) after manual tracing on the dura mater Figure 2. In addition, the normalized volume of the studied regions was defined using the following formula: (non-normalized region volume/ ICV) ×100.
Statistical analysis
The obtained data of this study were recorded at the Excel worksheets then analyzed using the statistical Minitab version 17 software (Minitab Inc., USA). ANOVA (analysis of variance) and unpaired t student tests were used. For all the comparisons p lower than 0.05 was considered as significant. The 95% confidence interval (CI) for variables was calculated. Pearson correlation test was used to determine linear correlation between quantitative variables.
Results
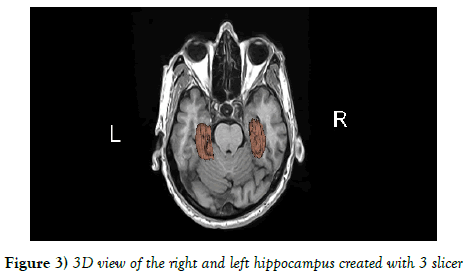
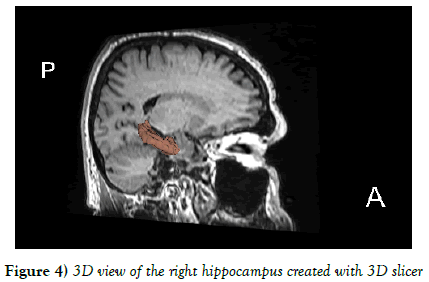
The mean values of right and left hippocampus were 2.629 ± 0.424 and 2.578 ± 0.437 cm3 respectively. There was a statistically insignificant difference between the volumes of right and left hippocampus in the entire population using independent t test (P=0.517) (Figures 3 and 4).
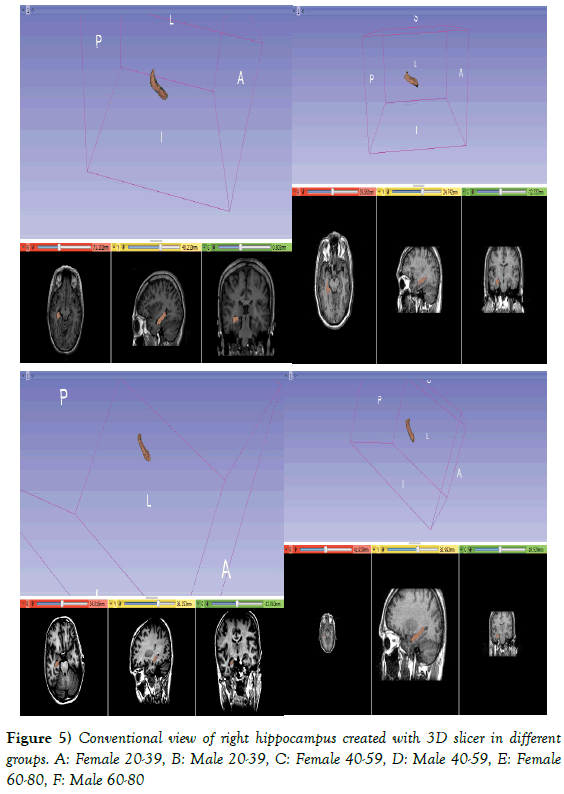
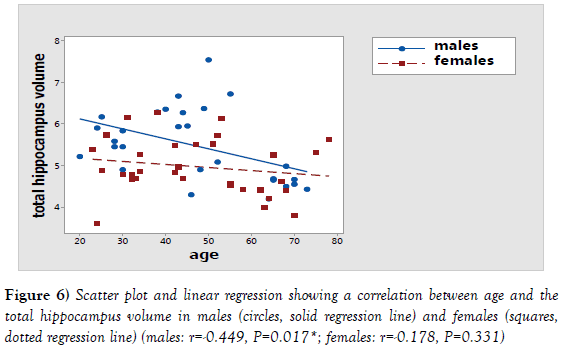
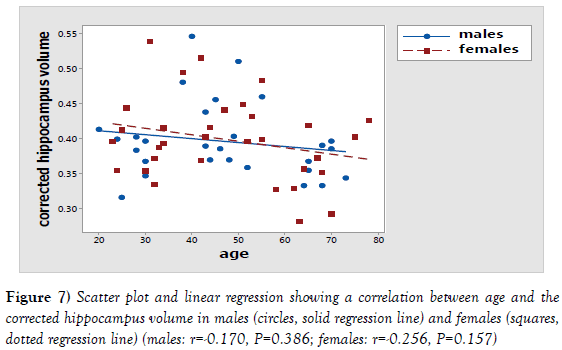
There was a statistically significant relation between the age and the volume of the measured and corrected hippocampus in males using one way ANOVA test. For the measured hippocampus volume, F value was 11.55 and P value was >0.001. After correction, F value was 4.01 and P value was >0.001 (Table 1). Further analysis showed a statistically significant negative correlation between the age and the measured hippocampus volume (P=0.017; r=-0.449) but, it showed a statistically insignificant negative correlation between the age and the corrected hippocampus volume (P=0.386; r=-0.170) (Table 2) (Figures 5-7).
| Parameter | Groups | Mean ± SD | P value | F value |
|---|---|---|---|---|
| Hippocampus | (20-39) | 5.641 ± 0.449 | > 0.001* | 11.55 |
| (40-59) | 6.007 ± 0.930 | |||
| (60-80) | 4.5774 ± 0.2260 | |||
| hippocampus/ICV | (20-39) | 0.3895 ± 0.0460 | > 0.001* | 4.01 |
| (40-59) | 0.4262 ± 0.0618 | |||
| (60-80) | 0.36284 ± 0.02588 |
Table 1: The mean values of the hippocampus in cm3 of the three different age groups in males before and after correction with ICV.
| Parameter | Age | ||
|---|---|---|---|
| R | P | Significance | |
| Hippocampus | -0.449 | 0.017* | Significant |
| hippocampus/ICV | -0.170 | 0.386 | Insignificant |
Table 2: Correlation between the age and the hippocampus in males from 20 years to 80 years before and after correction with ICV.
There was a statistically insignificant relation between the age and the volume of the measured hippocampus in females using one way ANOVA test (F=1.77 and P=0.188) but, There was a statistically significant relation between the age and the volume of the corrected hippocampus in females using one way ANOVA test (F=3.43and P=0.046) (Table 3).
| Parameter | Groups | Mean ± SD | P value | F value |
|---|---|---|---|---|
| Hippocampus | (20-39) | 5.086 ± 0.731 | 0.188 | 1.77 |
| (40-59) | 5.122 ± 0.572 | |||
| (60-80) | 4.621 ± 0.636 | |||
| hippocampus/ICV | (20-39) | 0.4082 ± 0.0598 | 0.046* | 3.43 |
| (40-59) | 0.4210 ± 0.0520 | |||
| (60-80) | 0.3589 ± 0.0522 |
Table 3: The mean values of the hippocampus in cm³ of the three different age groups in females before and after correction with ICV.
Further analysis showed a statistically insignificant negative correlation between the age and the volume of both the measured (P=0.331; r=-0.178) and the corrected hippocampus (p=0.157; r=-0.256) (Table 4; Figures 6 and 7).
| Parameter | Age | ||
|---|---|---|---|
| R | P | Significance | |
| Hippocampus | -0.178 | 0.331 | Insignificant |
| hippocampus/ICV | -0.256 | 0.157 | Insignificant |
Table 4: Correlation between the age and the hippocampus in females from 20 years to 80 years before and after correction with ICV.
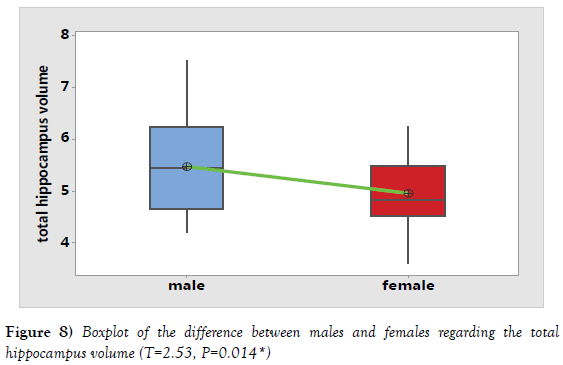
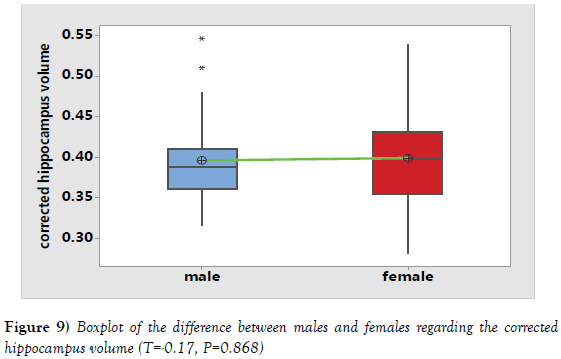
It was noticed that hippocampus volume increased in the second age group (40-59 years) followed by a subsequent age decrease in the third age group (60-80 years). So, the decline in the hippocampus volume started later after 60 years (Tables 1 and 3). By using independent t test, There was a statistically significant difference between the volumes of measured hippocampus in males and females (P=0.014). Meanwhile, a statistically insignificant difference was noted between the volumes of corrected hippocampus in males and females using independent T test (P=0.868) (Table 5; Figures 8 and 9).
| Parameter | Male(mean ± SD) | Female(mean ± SD) | T | P |
|---|---|---|---|---|
| Hippocampus | 5.481 ± 0.870 | 4.968 ± 0.670 | 2.53 | 0.014* |
| hippocampus\ICV | 0.3963 ± 0.0541 | 0.3987 ± 0.0593 | -0.17 | 0.868 |
Table 5: The difference between the volumes of the hippocampus in males and females before and after correction with ICV.
Discussion
In the present study, Hippocampus Volume (HCV) (measured and corrected) decreased with age in males. In females, it decreased with age after correction with ICV. Many studies have focused on the hippocampus and its volume changes with age. The majority of these studies reported volume reductions with age [5-9], while others found no age-related hippocampal volume changes [10-12]. The main reasons for wide range of variation in HCV were probably due to variation in anatomical boundaries and MR acquisition.
In this study, hippocampus volume increased in the second age group (40- 59 years) followed by a subsequent age decrease in the third age group (60- 80 years). Walhovd et al found that both hippocampus and cerebral white matter continue to increase in volume into the 30s and 40s, followed by a subsequent age decrease [8].
In the current study, there was no statistically significant difference of HCV between men and women. Several other researchers found similar results [13,14]. In a study involving 61 normal subjects of 6 to 82 years old, there were no statistically significance differences in either original or normalized HCVs among gender groups in a Chinese population. On the other hand, several studies have demonstrated a different result [15].
In a study involving 32 subjects, it revealed that men have significantly larger hippocampi than women (P<0.01) [16]. Another Chinese study involving 30 control subjects revealed that female subjects had slightly larger hippocampi, but this was not statistically significant (P>0.05) [17].
Several studies have revealed significant volumetric differences in HCV between Alzheimer disease and control groups; however, it has been difficult to judge whether these differences were due to pathologic processes or physiological atrophy. Thus, it is important to define a range of normal values for the hippocampal formation, the amygdala and the temporal horn amongst healthy subjects in different age groups [18].
The diagnosis of Alzheimer disease (AD) and primary degenerative dementia depends on neuropathologic evidence of senile plaques, neurofibrillary tangles, and cell loss, which predominate in the hippocampal formation, the amygdala, and the entorhinal cortex. The clinical diagnosis is not accurate for the early stages of AD and the limitations of performing pathologic examination in vivo so, MR imaging may be useful in the diagnosis of AD. In fact, MR-based volumetric measurements of the hippocampal formation and the amygdala have proved to be an important in vivo method for diagnosing AD [19,20].
References
- Jack CR, Dickson DW, Parisi JE, et al. Antemortem MRI findings correlate with hippocampal neuropathology in typical aging and dementia. Neurology. 2002;58:750-7.
- Sheline YI, Sanghavi M, Mintun MA, et al. Depression duration but not age predicts hippocampal volume loss in medically healthy women with recurrent major depression. J Neurosci. 1999;19:5034-43.
- Sullivan EV, Marsh L, Pfefferbaum A. Preservation of hippocampal volume throughout adulthood in healthy men and women. Neurobiol Aging. 2005;26:1093-8.
- Westmoreland P, Cretsinger K. The brain tracing guidelines. 2014.
- Allen JS, Bruss J, Brown CK, et al. Normal neuroanatomical variation due to age: the major lobes and a parcellation of the temporal region. Neurobiology of Aging. 2005;26:1245-82.
- Greenberg DL, Messer DF, Payne ME, et al. Aging, gender, and the elderly adult brain: an examination of analytical strategies. Neurobiology of Aging. 2008;29:290-302.
- Raz N, Ghisletta P, Rodrigue KM, et al. Trajectories of brain aging in middle-aged and older adults: regional and individual differences. NeuroImage. 2010;51:501-11.
- Walhovd KB, Fjell AM, Reinvang I, et al. Effects of age on volumes of cortex, white matter and subcortical structures. Neurobiology of Aging. 2005;26:1261-70.
- Walhovd KB, Westlye LT, Amlien I, et al. Consistent neuroanatomical age-related volume differences across multiple samples. Neurobiology of Aging. 2009;32:916-32.
- Du AT, Schuff N, Chao LL, et al. Age effects on atrophy rates of entorhinal cortex and hippocampus. Neurobiology of Aging. 2006;27:733-40.
- Liu RS, Lemieux L, Bell GS, et al. A longitudinal study of brain morphometrics using quantitative magnetic resonance imaging and difference image analysis. NeuroImage. 2003;20:22-33.
- Van Petten C. Relationship between hippocampal volume and memory ability in healthy individuals across the lifespan: review and meta-analysis. Neuropsychologia. 2004;42:1394-1413.
- Yucel K, Hakyemez B, Parlak M, et al. Morphometry of some elements of limbic system in normal population: a quantitative MRI study. Neuroanatomy. 2002;1:15-21.
- Zou L, Zhoul X, Sun C. Hippocampal formations, amygdala and anterior temporal lobes: normative volumetric measurement from MR imaging in normal adults of China. Sichuan Da Xue Xue Bao Yi Xue Ban. 2003;34:719-22.
- Li YJ, Ga SN, Huo Y, et al. Characteristics of hippocampal volumes in healthy Chinese from MRI. Neurol Res. 2007;29:803-6.
- Free SL, Bergin PS, Fish DR, et al. Methods for normalization of hippocampal volumes measured with MR. AJNR Am J Neuroradiol. 1995;16:637-43.
- Cheon J, Chang K, Kim H, et al. MR of hippocampal sclerosis : comparison of qualitative and quantitative assessments. Am J Neuroradiol. 1998;19:465-8.
- Cook MJ, Fish DR, Shorvon SD, et al. Hippocampal volumetric and morphometric studies in frontal and temporal lobe epilepsy. Brain. 1992;115:1001-15.
- Kaye JA, Swihaart T, Howieson D, et al. Volume loss of the hippocampus and temporal lobe in healthy persons destined to develop dementia. Neurology. 1997;40:1297-1304.
- Lehericy S, Baulac M, Chiras J, et al. Amygdalahippocampal. MR volume measurements in the early stages of Alzheimer disease. AJNR Am J Neuroradiol. 1994;15:929-37.
Ismail R1,*, Eltomey M2, Mahdy A1 and Elkattan A1
1Department of Human Anatomy, Tanta University of Medical Sciences, Tanta, Egypt.
2Department of Radiology, Tanta University of Medical Sciences, Tanta, Egypt.
- *Corresponding Author:
- Dr. Radwa R Ismail
Department of Human Anatomy ,Tanta University of Medical Sciences, Tanta, Egypt.
Tel: 00201288740746
E-mail: dr_roda2010@yahoo.com
Citation: Ismail R, Eltomey M, Mahdy A, et al. Hippocampal volumetric variations in the normal human brain by magnetic resonance imaging (MRI). Int J Anat Var. 2017;10(3):33-6.
Copyright: This open-access article is distributed under the terms of the Creative Commons Attribution Non-Commercial License (CC BY-NC) (http://creativecommons.org/licenses/by-nc/4.0/), which permits reuse, distribution and reproduction of the article, provided that the original work is properly cited and the reuse is restricted to noncommercial purposes. For commercial reuse, contact reprints@pulsus.com
-Keywords
Brain MRI; Age; Sex; Hippocampus
Introduction
The morphology and size of the human brain and its major anatomically defined subdivisions are very important for understanding neurological diseases and also for neurosurgery. The widespread use of high-resolution neuroimaging techniques began in the early 1990s, and since then, numerous studies have been undertaken that apply these techniques to the volume measurement of various brain structures.
Hippocampal volume (HCV) is well preserved throughout adulthood in men and women, with no significant correlation with age. HCV is affected by several neurodegenerative and psychiatric diseases. Alzheimer disease (AD) is the most common disorder associated with reduced hippocampal volume [1-3].
Subjects and Methods
Subjects
The study included 60 healthy patients, 28 males and 32 females, who had normal brain MRI study. These subjects were chosen from MRI scanning unit of radiology department in Tanta university hospital. Their ages ranged between 20 to 80 years (mean 47.1 ± 16). The main indication for the MRI studies was investigation of the cause of headache. Patients with positive neurological and imaging findings were excluded from the study. The study was performed between May, 2014 and March, 2015 and approved by the Ethics Committee of faculty of medicine.
The study subjects were further classified into three age groups as follows:
Group I: included 21 persons, 9 males and 12 females, their ages ranged between 20-39 years old.
Group II: included 22 persons; 11 males and 11 females, their ages ranged between 40-59 years old.
Group III: included 17 persons; 8 males and 9 females, their ages ranged between 60-80 years old.
Methods
MRI scanning machine
MRI scans were performed at the MRI scanning units in the Radiology Department at our institution. The machines used were the GE Signa 1.5T system (GE Medical systems, Wisconsin, USA) and Toshiba Titan Vantage 1.5T system (Toshiba Medical Systems, Japan).
MRI Processing
Magnetic resonance imaging (MRI) of the brain
Routine brain MRI protocol was performed, including axial (T1WI and T2WI), coronal PDWI and sagittal T1WI. A 3D T1WI sequence was performed with slice thickness 0.5 mm and slice spacing 0 mm. The study images were transferred into DICOM format to a personal computer (PC) workstation having 3D Slicer 4.3.3.1 software installed on it which is a multiplatform, free open source software package for visualization and medical image computing developed by Harvard University and approved for medical research (http://www.slicer.org/). The software helps in providing reliable morphometry of the structures of interest by manual and semiautomated methods. Studied structure is the hippocampus, Volumetric analysis was performed on the 3D T1-weighted images in axial and sagittal planes. Manual and semi-automated tracing of the structures of interest was done which allowed for volume calculation by summation the trace areas in the consecutive slices multiplied by the slice thickness. The total volumes were measured after manually tracing both the right and left side. The total intracranial volume was calculated and volumes of each region of interest were expressed as a percent of the intracranial volume. All volumes were described in cubic centimeters.
Delineation of the studied regions
Delineation means drawing labels to define regions of interest within a brain using semi-automated. The volume of hippocampus was estimated from 30 sagittal slices. Hippocampus proper, the subicular complex, dentate gyrus, alveus, and hippocampal fimbria were included for measurement of hippocampal body and tail. Measurement excluded the amygdala, parahippocampal gyrus, isthmus of the cingulated gyrus, and the crus of fornix (Figure 1) [4].
Figure 1: Normal T1-weighted sagittal MRI of brain showed outlines of the hippocampus.
Intracranial volume (ICV)
Intracranial volume was estimated using the T1WI MRI sequence with 30 axial slices (5 mm slice thickness, 2 mm gap) after manual tracing on the dura mater Figure 2. In addition, the normalized volume of the studied regions was defined using the following formula: (non-normalized region volume/ ICV) ×100.
Figure 2: Axial T1-weighted MRI of the brain in a normal individual showing the delineation of the outlines of the dura matter in one of its slices to calculate the intracranial volume.
Statistical analysis
The obtained data of this study were recorded at the Excel worksheets then analyzed using the statistical Minitab version 17 software (Minitab Inc., USA). ANOVA (analysis of variance) and unpaired t student tests were used. For all the comparisons p lower than 0.05 was considered as significant. The 95% confidence interval (CI) for variables was calculated. Pearson correlation test was used to determine linear correlation between quantitative variables.
Results
The mean values of right and left hippocampus were 2.629 ± 0.424 and 2.578 ± 0.437 cm3 respectively. There was a statistically insignificant difference between the volumes of right and left hippocampus in the entire population using independent t test (P=0.517) (Figures 3 and 4).
There was a statistically significant relation between the age and the volume of the measured and corrected hippocampus in males using one way ANOVA test. For the measured hippocampus volume, F value was 11.55 and P value was >0.001. After correction, F value was 4.01 and P value was >0.001 (Table 1). Further analysis showed a statistically significant negative correlation between the age and the measured hippocampus volume (P=0.017; r=-0.449) but, it showed a statistically insignificant negative correlation between the age and the corrected hippocampus volume (P=0.386; r=-0.170) (Table 2) (Figures 5-7).
| Parameter | Groups | Mean ± SD | P value | F value |
|---|---|---|---|---|
| Hippocampus | (20-39) | 5.641 ± 0.449 | > 0.001* | 11.55 |
| (40-59) | 6.007 ± 0.930 | |||
| (60-80) | 4.5774 ± 0.2260 | |||
| hippocampus/ICV | (20-39) | 0.3895 ± 0.0460 | > 0.001* | 4.01 |
| (40-59) | 0.4262 ± 0.0618 | |||
| (60-80) | 0.36284 ± 0.02588 |
Table 1: The mean values of the hippocampus in cm3 of the three different age groups in males before and after correction with ICV.
| Parameter | Age | ||
|---|---|---|---|
| R | P | Significance | |
| Hippocampus | -0.449 | 0.017* | Significant |
| hippocampus/ICV | -0.170 | 0.386 | Insignificant |
Table 2: Correlation between the age and the hippocampus in males from 20 years to 80 years before and after correction with ICV.
There was a statistically insignificant relation between the age and the volume of the measured hippocampus in females using one way ANOVA test (F=1.77 and P=0.188) but, There was a statistically significant relation between the age and the volume of the corrected hippocampus in females using one way ANOVA test (F=3.43and P=0.046) (Table 3).
| Parameter | Groups | Mean ± SD | P value | F value |
|---|---|---|---|---|
| Hippocampus | (20-39) | 5.086 ± 0.731 | 0.188 | 1.77 |
| (40-59) | 5.122 ± 0.572 | |||
| (60-80) | 4.621 ± 0.636 | |||
| hippocampus/ICV | (20-39) | 0.4082 ± 0.0598 | 0.046* | 3.43 |
| (40-59) | 0.4210 ± 0.0520 | |||
| (60-80) | 0.3589 ± 0.0522 |
Table 3: The mean values of the hippocampus in cm³ of the three different age groups in females before and after correction with ICV.
Further analysis showed a statistically insignificant negative correlation between the age and the volume of both the measured (P=0.331; r=-0.178) and the corrected hippocampus (p=0.157; r=-0.256) (Table 4; Figures 6 and 7).
| Parameter | Age | ||
|---|---|---|---|
| R | P | Significance | |
| Hippocampus | -0.178 | 0.331 | Insignificant |
| hippocampus/ICV | -0.256 | 0.157 | Insignificant |
Table 4: Correlation between the age and the hippocampus in females from 20 years to 80 years before and after correction with ICV.
It was noticed that hippocampus volume increased in the second age group (40-59 years) followed by a subsequent age decrease in the third age group (60-80 years). So, the decline in the hippocampus volume started later after 60 years (Tables 1 and 3). By using independent t test, There was a statistically significant difference between the volumes of measured hippocampus in males and females (P=0.014). Meanwhile, a statistically insignificant difference was noted between the volumes of corrected hippocampus in males and females using independent T test (P=0.868) (Table 5; Figures 8 and 9).
| Parameter | Male(mean ± SD) | Female(mean ± SD) | T | P |
|---|---|---|---|---|
| Hippocampus | 5.481 ± 0.870 | 4.968 ± 0.670 | 2.53 | 0.014* |
| hippocampus\ICV | 0.3963 ± 0.0541 | 0.3987 ± 0.0593 | -0.17 | 0.868 |
Table 5: The difference between the volumes of the hippocampus in males and females before and after correction with ICV.
Discussion
In the present study, Hippocampus Volume (HCV) (measured and corrected) decreased with age in males. In females, it decreased with age after correction with ICV. Many studies have focused on the hippocampus and its volume changes with age. The majority of these studies reported volume reductions with age [5-9], while others found no age-related hippocampal volume changes [10-12]. The main reasons for wide range of variation in HCV were probably due to variation in anatomical boundaries and MR acquisition.
In this study, hippocampus volume increased in the second age group (40- 59 years) followed by a subsequent age decrease in the third age group (60- 80 years). Walhovd et al found that both hippocampus and cerebral white matter continue to increase in volume into the 30s and 40s, followed by a subsequent age decrease [8].
In the current study, there was no statistically significant difference of HCV between men and women. Several other researchers found similar results [13,14]. In a study involving 61 normal subjects of 6 to 82 years old, there were no statistically significance differences in either original or normalized HCVs among gender groups in a Chinese population. On the other hand, several studies have demonstrated a different result [15].
In a study involving 32 subjects, it revealed that men have significantly larger hippocampi than women (P<0.01) [16]. Another Chinese study involving 30 control subjects revealed that female subjects had slightly larger hippocampi, but this was not statistically significant (P>0.05) [17].
Several studies have revealed significant volumetric differences in HCV between Alzheimer disease and control groups; however, it has been difficult to judge whether these differences were due to pathologic processes or physiological atrophy. Thus, it is important to define a range of normal values for the hippocampal formation, the amygdala and the temporal horn amongst healthy subjects in different age groups [18].
The diagnosis of Alzheimer disease (AD) and primary degenerative dementia depends on neuropathologic evidence of senile plaques, neurofibrillary tangles, and cell loss, which predominate in the hippocampal formation, the amygdala, and the entorhinal cortex. The clinical diagnosis is not accurate for the early stages of AD and the limitations of performing pathologic examination in vivo so, MR imaging may be useful in the diagnosis of AD. In fact, MR-based volumetric measurements of the hippocampal formation and the amygdala have proved to be an important in vivo method for diagnosing AD [19,20].
References
- Jack CR, Dickson DW, Parisi JE, et al. Antemortem MRI findings correlate with hippocampal neuropathology in typical aging and dementia. Neurology. 2002;58:750-7.
- Sheline YI, Sanghavi M, Mintun MA, et al. Depression duration but not age predicts hippocampal volume loss in medically healthy women with recurrent major depression. J Neurosci. 1999;19:5034-43.
- Sullivan EV, Marsh L, Pfefferbaum A. Preservation of hippocampal volume throughout adulthood in healthy men and women. Neurobiol Aging. 2005;26:1093-8.
- Westmoreland P, Cretsinger K. The brain tracing guidelines. 2014.
- Allen JS, Bruss J, Brown CK, et al. Normal neuroanatomical variation due to age: the major lobes and a parcellation of the temporal region. Neurobiology of Aging. 2005;26:1245-82.
- Greenberg DL, Messer DF, Payne ME, et al. Aging, gender, and the elderly adult brain: an examination of analytical strategies. Neurobiology of Aging. 2008;29:290-302.
- Raz N, Ghisletta P, Rodrigue KM, et al. Trajectories of brain aging in middle-aged and older adults: regional and individual differences. NeuroImage. 2010;51:501-11.
- Walhovd KB, Fjell AM, Reinvang I, et al. Effects of age on volumes of cortex, white matter and subcortical structures. Neurobiology of Aging. 2005;26:1261-70.
- Walhovd KB, Westlye LT, Amlien I, et al. Consistent neuroanatomical age-related volume differences across multiple samples. Neurobiology of Aging. 2009;32:916-32.
- Du AT, Schuff N, Chao LL, et al. Age effects on atrophy rates of entorhinal cortex and hippocampus. Neurobiology of Aging. 2006;27:733-40.
- Liu RS, Lemieux L, Bell GS, et al. A longitudinal study of brain morphometrics using quantitative magnetic resonance imaging and difference image analysis. NeuroImage. 2003;20:22-33.
- Van Petten C. Relationship between hippocampal volume and memory ability in healthy individuals across the lifespan: review and meta-analysis. Neuropsychologia. 2004;42:1394-1413.
- Yucel K, Hakyemez B, Parlak M, et al. Morphometry of some elements of limbic system in normal population: a quantitative MRI study. Neuroanatomy. 2002;1:15-21.
- Zou L, Zhoul X, Sun C. Hippocampal formations, amygdala and anterior temporal lobes: normative volumetric measurement from MR imaging in normal adults of China. Sichuan Da Xue Xue Bao Yi Xue Ban. 2003;34:719-22.
- Li YJ, Ga SN, Huo Y, et al. Characteristics of hippocampal volumes in healthy Chinese from MRI. Neurol Res. 2007;29:803-6.
- Free SL, Bergin PS, Fish DR, et al. Methods for normalization of hippocampal volumes measured with MR. AJNR Am J Neuroradiol. 1995;16:637-43.
- Cheon J, Chang K, Kim H, et al. MR of hippocampal sclerosis : comparison of qualitative and quantitative assessments. Am J Neuroradiol. 1998;19:465-8.
- Cook MJ, Fish DR, Shorvon SD, et al. Hippocampal volumetric and morphometric studies in frontal and temporal lobe epilepsy. Brain. 1992;115:1001-15.
- Kaye JA, Swihaart T, Howieson D, et al. Volume loss of the hippocampus and temporal lobe in healthy persons destined to develop dementia. Neurology. 1997;40:1297-1304.
- Lehericy S, Baulac M, Chiras J, et al. Amygdalahippocampal. MR volume measurements in the early stages of Alzheimer disease. AJNR Am J Neuroradiol. 1994;15:929-37.


