Phospholipase A2 isoforms in benzo (α) pyrene-induced molecular changes in colon cancer cells: A plausible therapeutic target
2 Department of Biotechnology, y, Maharishi Markandeshwar (Deemed to be) University, Mullana, Ambala, Haryana, India
3 Department of Gastroenterology, Postgraduate Institute of Medical Education and Research, Chandigarh, India
Received: 10-Dec-2021, Manuscript No. PULHHR-21-4034; Editor assigned: 15-Dec-2021, Pre QC No. PULHHR-21-4034; Accepted Date: Jan 20, 2022; Reviewed: 05-Jan-2022 QC No. PULHHR-21-4034; Revised: 15-Jan-2022, Manuscript No. PULHHR-21-4034; Published: 02-Feb-2022, DOI: 10.37532/pulhhr.22.6(2).42-50
This open-access article is distributed under the terms of the Creative Commons Attribution Non-Commercial License (CC BY-NC) (http://creativecommons.org/licenses/by-nc/4.0/), which permits reuse, distribution and reproduction of the article, provided that the original work is properly cited and the reuse is restricted to noncommercial purposes. For commercial reuse, contact reprints@pulsus.com
Abstract
INTRODUCTION: Colorectal cancer is the third most common cancer prevalent in men, and the second in women worldwide. The exact cause and pathogenesis of this disease remains unknown. In every cell multiple Phospholipase A2 (PLA2) exists, but their contribution to the cell function has yet not been determined. This study has explored the pathways involved in the differential response of HCT-15 and HT-29 colon cell lines during benzo(α)pyrene [B(α)P]-induced molecular changes.
METHODS: B(α)P]-induced molecular changes were evaluated through cell viability using MTT assay, Reactive Oxygen Species (ROS) measurement. The gene expressions of PLA2 isoforms were estimated by RT- PCR. Further, knockdown of PLA2 isoform in transfected cells was done with siRNA.
RESULTS: The cell viability decreased whereas ROS production increased significantly after exposure with B(α)P in both cell lines. Three PLA2 isoforms such as IB and, IID, IVA were induced after exposure with B(α)P respectively in HT -29 and HCT-15 cell lines. There was a significant induction of ROS in IVA transfected HCT-15 cells exposure with B(α)P.
DISCUSSION: CS continues to remain one of the most important health hazards and it contributes extensively too many diseases including respiratory disorders characterized by inflammatory changes in the lungs. It is involved in many other cancers like pharynx, larynx, esophagus, etc. various studies also suggested the relationship between smoking and stomach, liver and colon cancer.
CONCLUSION: It is concluded that each cell line behaved differently, specific PLA2 siRNA are involved in controlling the cascades related ROS, depending upon the origin of the cells. Secretary Phospholipase A2 inhibitors are likely to have a therapeutic potential in colon pathologies.
Keywords
Colorectal cancer; Cigarette smoke condensate; Phospholipases A2; Colon cell lines; Reactive oxygen species; siRNA
Introduction
Colorectal Cancer (CRC) is the third most common cancer in men and the second in women worldwide [1]. The incidence of CRC has been reported to increase 2–4 times in the past few decades in many countries of the Asia-Pacific region. Presently the most common treatment option is surgery, and that also depends on various factors like the site of the cancer and the presence and extent of metastasis. The risk of colorectal cancer begins with the formation of abnormal polyp growth that later grows to cancer. The major causes include the over-eating, alcohol consumption and smoking. Studies also suggest that a proper life-style maintenance including the controlled diet could reduce the abnormal polyp formation and further cancer. Ursolic acid is a phytochemical present in most plants and has the ability to reduce the cell proliferation of breast and colon cancer cells through various pathways [2]. The Benzo(α)pyrene [B(α)P], a known carcinogen, presents in diet and environment such as grilled meats, Cigarette Smoke (CS), and by-products of industrial incineration [3]. The oxidative stress caused by the constituents of CS such as B(α)P in normal as well as in the mutated cells may lead to the remodelling of membrane lipids through upregulation of various signalling events such as activation of lipid specific enzymes especially phospholipases. Almost in every cell type, multiple isoforms of Phospholipase A2 (PLA2) but their contribution to the cell functions has not yet been clearly determined.
Phospholipase A2 superfamily is composed of many lipolytic enzymes whose common feature is to hydrolyze the fatty acid present in the sn-2 position of glycerophospholipids. It is reported that PLA2 can act synergistically with Reactive Oxygen Species (ROS) to cause cellular injury due to enhanced susceptibility of peroxidized membrane to the action of PLA2. Phospholipases type A2 is involved in the generation of a wide range of biomediators, including lysophospholipids, arachidonic acid, and metabolites of arachidonic acid that can enhance tumor cell growth, invasion, and metastasis [4]. Further, it was reported that PLA2 also acts as a stem cell niche factor that play a role in inflammation in colon cancer via Wnt pathway [5]. However, it is not known whether PLA2 isoforms are expressed in human colon cancer and whether PLA2 isoforms influence the malignant potential of colon cancer cells. Besides that, PLA2 isoenzymes may behave differentially to Cigarette Smoke Condensate (CSC) and B(α)P (a major carcinogen of cigarette smoke) in vitro.This study aims to explore the pathways involved in the differential response of HCT-15 and HT-29 colon cell lines during [B(α)P]-induced molecular changes.
Method
Cell lines
Colon adenocarcinoma cancer cell lines (HCT-15 and HT-29) were procured from National Centre for Cell Science, Pune, India.
[B(α)P] preparation
B(α)P were procured from sigma USA and dissolved in DMSO, the working concentration (0.025%) was prepared in a sterile medium.
Cell culture
HCT-15 and HT-29 were maintained in continuous culture at 37°C and 5% CO2 in RPMI-1640 and DMEM medium supplemented with 10% Fetal Bovine Serum (FBS), 2 mM L-glutamine, 100 units/ml penicillin, 100 µg/ml streptomycin and 0.5 µg/ml fungizone respectively.
Cell viability assay
Effect of B(α)P on cell viability was evaluated by the 3-(4, 5- dimethylthiazol-2-yl)-diphenyltetrazolium bromide (MTT) dye uptake method described previously [6]. Briefly, 2 × 10³ cells were seeded in 96- well plates, and treated with varying concentrations of B(α)P for 24 hours, 48 hours, and 72 hours. After the desired incubation time, 20 μl of MTT solution (2.5 mg/ml) was added to each well. After 4 hours, resultant formazan crystals were dissolved in 40 μl of lysis buffer (20% SDS dissolved in 50% each of DMF and ddH2O). The developed colour was read at 570 nm on ELISA reader.
ROS and Superoxide Radicals (SOR)
Levels of intracellular ROS, mitochondrial ROS and SOR were measured by the shift in fluorescent intensity resulting from oxidation of DCFH-DA (for ROS), DHR123 (for Mitochondrial ROS) and DHE (for Superoxide radical) fluorescence dye [7]. Briefly, 0.55 × 10⁵ cells/well were seeded into 12-well plates and allowed to grow overnight in complete media. After 24 hours of incubation, the medium was replaced with a fresh medium and the cells were treated with varying concentrations of B(α)P for a specific time interval. Cells were incubated with 5 μM DCFH-DA, 10 μM DHR123 or 10 μM DHE fluorescence dye for 30 min. Cells were challenged with B(α)P for 24 hours and 48 hours. Thereafter, cells were washed, harvested and resuspended in chilled Phosphate Buffer Saline (PBS). Finally, cells were subjected to Fluorescence-Activated Cell Sorting (FACS; Beckton Dickinson FACSCan). Levels of ROS and SOR were represented in terms of Mean Fluorescent Intensity (MFI).
RNA extraction and cDNA synthesis
Total RNA was isolated by using Trizol reagent according to the manufacturer’s instructions. Briefly, 1 ml Trizol reagent was added to the cells followed by chloroform. The mixture was incubated at room temperature for 15 min and centrifuged at 12000x gm for 15 min at 4°C resulting in the separation of an upper aqueous phase and lower organic phase. The upper aqueous phase was carefully transferred to a fresh eppendorf tube. After adding and shaking with isopropanol mixture was incubated for 10 min and then centrifuged at 12000x gm for 10 min. The pellet thus obtained was washed with 75% ethanol followed by centrifugation for 5 min at 7,500x gm. The RNA pellet was air-dried and dissolved in an appropriate volume of DEPC water and stored at -80°C. Spectrophotometric measurement of RNA was done to quantify its purity. Further, one microgram RNA was used for cDNA synthesis. The cDNA synthesis was carried out from the purified and intact total RNA by using the Revert AidTM first strand cDNA synthesis kit (Fementas) according to the manufacturer’s instructions.
Reverse Transcription-Polymerase Chain Reaction (RT-PCR)
Effect of B(α)P on mRNA expression of PLA2 isoforms was conducted through RT-PCR for the analysis of mRNA levels of PLA2 groups (IB, IID, III, IVA, IVB, IVC, VI, X, acid iPLA2, iPLA2). In RT-PCR reactions (25 µl) 100 ng cDNA was used as template DNA. The primer sequences were designed from the mRNA sequence of genes available in the Genebank or from previously published literature. The details of primer sequences and RT-PCR conditions used for the study are given in Table 1. The expression levels of different genes were calculated by relative quantification using b-actin transcript levels for normalization. The fold change in mRNA expressions was calculated by the comparative Ct method [8].
TABLE 1. Primer Sequences of various genes
| S.No. | Name | Primer Sequence | Product Size (bp) |
|---|---|---|---|
| 1 | PLA2-IB | [s], 5’- CTCAGGCACCCCCGTGGATGA -3’ | 207 |
| [a], 5’- GCGTTGCGGTCGCAGTTGCA -3’ | |||
| 2 | PLA2-IID | [s], 5’- CACCTGCTGGCCCCCTTGTC-3’ | 244 |
| [a], 5’- CAGGCATGGCCTCCACCTGC -3’ | |||
| 3 | PLA2-III | [s], 5’-ACAACTCTTCTATGCCTGG-3’ | 256 |
| [a], 5’-TGTGACATCCCTAACTTCC-3’ | |||
| 4 | PLA2-IVA | [s], 5’-GTTGCTGGTCTTTCTGGCTC-3’ | 313 |
| [a], 5’-GGTAAAGGGCATTGTGCAGT-3’ | |||
| 5 | PLA2-IVB | [s], 5’- GCTGCAAGGGAGCTCTGCGT -3’ | 286 |
| [a], 5’- CCAGCACGAAGCTCAGGGGC -3’ | |||
| 6 | PLA2-IVC | [s], 5’-CGATTTACCCGAGGAGTGG-3’ | 329 |
| [a], 5’-GCTTCCGAAGTGGGTTATGG-3’ | |||
| 7 | PLA2-VI | [s], 5’-TGCGCAACCGCTTCGACTGT-3’ | 214 |
| [a], 5’-AGTTGTCTGCCGATTTTGGAGGC-3’ | |||
| 8 | PLA2-X | [s], 5’- TCCCTTATTCCGAGGAGACTTCCCT -3’ | 395 |
| [a], 5’- CCACGCCGGTGCACACGTAA -3’ | |||
| 9 | Acid-iPLA2 | [s], 5’- AGGTCTGCTTCTCGGGGACGTG -3’ | 241 |
| [a], 5’- GCTCCAGGCAAGATGGTCCTCA -3’ | |||
| 10 | iPLA2-2 | [s], 5’- GGACCCGGGCATTAGTTCAGGCA -3’ | 286 |
| [a], 5’- GCAACCACGCCCCTTGTTCCT -3’ | |||
|
|
|
|
|
PLA2 gene silencing
PLA2 siRNA (IB, IID and IVA from Sigma Aldrich, USA) and scrambled siRNA were transfected into HCT-15 cells using transfection lipofectamineTM 2000 reagent as described previously [9]. The sequences of all siRNAs used in this study are provided in Table 2. Briefly, in HT-29 (IB) and HCT-15 (IID and IVA) cells the PLA2 gene was silenced by using specific siRNA against the group IB, IID and IVA PLA2 gene. The cells (15 × 105 per well) were seeded in 2 ml antibiotic-free medium supplemented with 10% FBS in a six-well culture plate. After 60%-80% confluency the cells were siRNA (IB, IID and IVA from Sigma Aldrich, USA) and scrambled siRNA were transfected into HCT-15 cells using transfection lipofectamineTM 2000 reagent. Briefly, in HT-29 (IB) and HCT-15 (IID and IVA) cells the PLA2 gene was silenced by using specific siRNA against the group IB, IID and IVA PLA2 gene. The cells (15 × 105 per well) were seeded in 2 ml antibiotic free medium supplemented with 10% FBS in a six well culture plate. After 60-80% confluency the cells were transfected with transfection reagents for 6-8 hours at 37°C in a CO2 incubator following the recommended protocol provided with siRNA oligos. Before transfection, the medium was replaced with fresh medium without antibiotics. After transfection, additional media was added with 20% FBS so that, the final concentration of FBS becomes 10% in the final mixture followed by the treatment with a specific concentration of B(α)P for 48 hours. After completion of the incubation time, total RNA was isolated as mentioned above. Similarly, one microgram of RNA was converted into cDNA and expression of group IB, IID and IVA PLA2 was checked by qRT- PCR (Lightcycler 480, Roche diagnostics, Germany).
TABLE 2. Sequences of siRNAs
| S. No. | Name of target gene | Sequence of siRNAs |
|---|---|---|
| 1 | PLA2 IB | Sense 5’ CCCGUACACCCACACCUAU (dT)[dT] 3' |
| Anti-sense 5’ AUAGGUGUGGGUGUACGGG (dT)[dT] 3' | ||
| 2 | PLA2 IID | Sense 5’ CUUCUGACCUUCUGAAGCU (dT)[dT] 3' |
| Anti-sense 5’ AGCUUCAGAAGGUCAGAAG (dT)[dT] 3' | ||
| 3 | PLA2 IVA | Sense 5’ GACAUAAACCCUGUGUGGA (dT)[dT] 3' |
| Anti-sense 5’ UCCACACAGGGUUUAUGUC (dT)[dT] 3' | ||
| 4 | Scrambled control | Sense 5' UUCUCCGAACGUGUCACGU (dT)[dT] 3' |
| Anti-sense 5' ACGUGACACGUUCGGAGAA (dT)[dT] 3’ | ||
|
|
|
Statistical analysis
The data were analyzed using the SPSS 16.0 software. All results were expressed as mean ± SD. The differences in all data were assessed by one-way analysis of variance (ANOVA) by the Bonferroni test and nonparametric method such as Kurskali Wallice wherever required. The difference was taken as statistically significant at p<0.05.
Results
Loss effects of various concentrations of [B(α)P] on cell viability
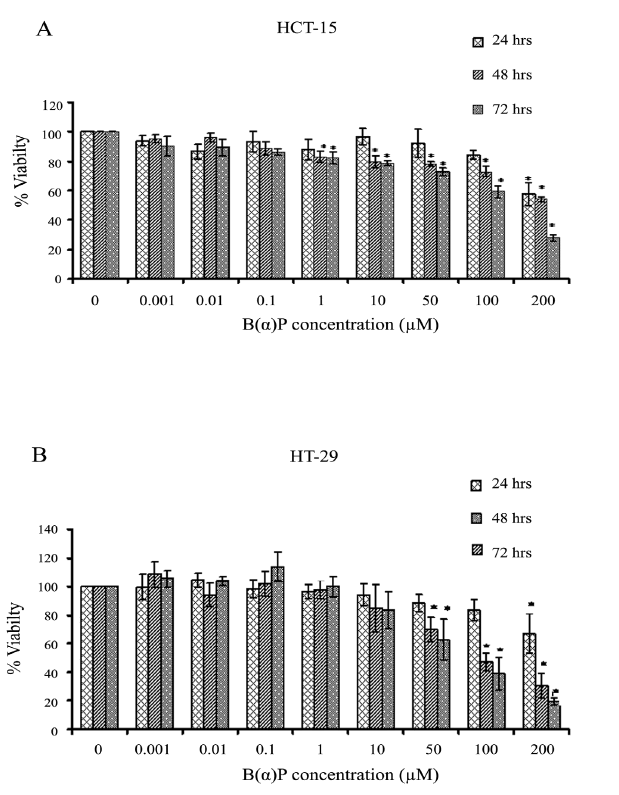
Figure 1 shows the effect of [B(α)P] on the viability of HCT-15 and HT-29 cells. Significant cytotoxicity in HCT-15 cells was observed at 1.0 µM concentration of benzo(α)pyrene at 48 hours and 72 hours (p=0.042). Whereas, at 24 hours it was evident only at 100 µM (p=0.038). Cell survival at 1.0 μM, 10 μM, 50 μM, 100 μM, and 200 μM concentrations of B(α)P was found to be 88% ± 6.9%, 97% ± 5.5%, 92% ± 9.5%, 84% ± 3.1% and 58% ± 7.6% at 24 hours; 83% ± 3.6%, 80% ± 4.0%, 78% ± 1.5%, 73% ± 3.6% and 54% ± 1.7% at 48 hours; and 82% ± 4.0%, 79% ± 1.5%, 73% ± 2.6%, 59% ± 4.0% and 28% ± 2.1% at 72 hours respectively as compared to control in HCT-15 cells (Figure 1). Whereas, HT-29 cells were found to be in comparison to HCT-15 cells resistant to B(α)P as survival at 1.0 μM, 10 μM, 50 μM, 100 μM, and 200 μM concentration was found to be 96% ± 4.7%, 94% ± 7.7%, 89% ± 6.2%, 83% ± 7.3% and 67% ± 13.8% at 24 hours; 98% ± 6.4%, 85% ± 16.6%, 70% ± 8.5%, 47% ± 6.1% and 31% ± 8.5% at 48 hours; and 100% ± 6.9%, 84% ± 13.1%, 63% ± 14.4%, 39% ± 11.2% and 20% ± 2.6% at 72 hours respectively as compared to control (Figure 1).
Figure 1: (A) Effect of B(α)P treatment on cell viability (MTT assay) in HCT-15 cells (B) Effect of B(α)P treatment on cell viability (MTT assay) in HT-29 cells. Both the cell lines were treated with different concentrations of B(α)P for 24 hours, 48 hours and 72 hours. Results are expressed as mean ± SD of three assays. *p<0.05; *B(α)P treated cells compared with respective controls
Intracellular ROS production
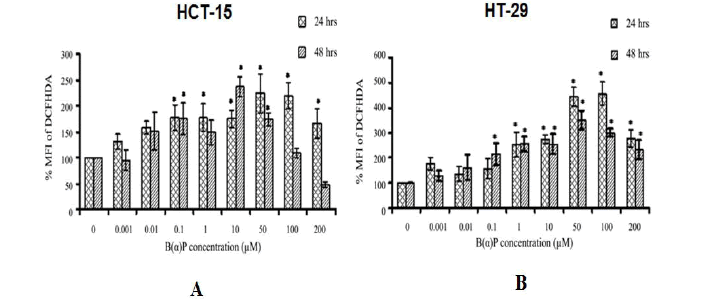
Total ROS production in HCT-15 and HT-29 cells by B(α)P concentrations at different time intervals is shown in Figure 2. In HCT-15 cells, ROS production was found to be significantly increased 48 hours after treatment of cells with varying concentrations of B(α)P (0.1 µM, 1.0 µM, 10 µM, 50 µM, 100 µM and 200 µM) respectively as compared to control (100%) (p=0.036) (Figure 2). In HT-29 cells, total ROS production was found to be 157% ± 39.1%, 254% ± 48.1%, 274% ± 18.3%, 444% ± 39.5%, 455% ± 46.0% and 279% ± 34.4% at 24 hours and, 214% ± 43.7%, 255% ± 29.8%, 255% ± 38.5%, 350% ± 37.2%, 300% ± 14.1%, and 232% ± 38.8% at 48 hr after treatment of cells at the above mentioned concentrations of B(α)P respectively as compared to control (100%) (p=0.042) (Figure 2).
Figure 2: (A) Effect of B(α)P treatment on ROS production (by DCFH-DA fluorescence dye) in HCT-15 cells (B) Effect of B(α)P treatment on ROS production (by DCFH-DA fluorescence dye) in HT-29 cells. Both the cell lines were treated with different concentrations of B(α)P for 24 hours and 48 hours including 30 minutes with fluorescence dye at the end phase. Cells were then washed with sterile PBS, and de-adhered for final analysis. Results are expressed as mean ± SD of three assays. *p<0.05; *B(α)P treated cells compared with respective controls
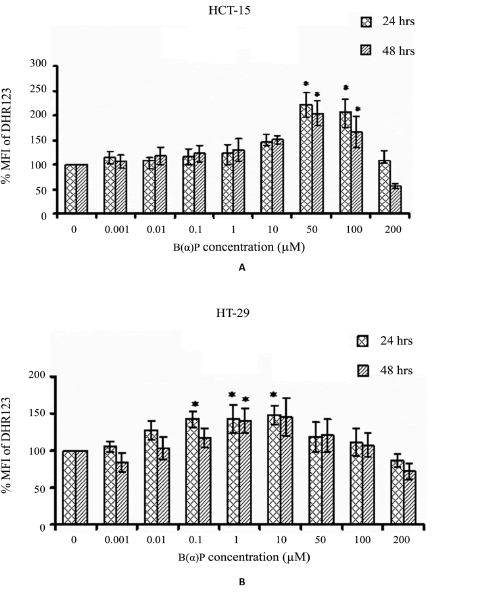
Mitochondrial ROS levels after treatment with varying B(α)P concentrations (0 μM to 200 μM) in both the cell lines are shown in Figure 3. In HCT-15 cells maximum the generation of ROS was observed at 50 μM concentration of B(α)P (221% vs 100% (control)). However, the generation of ROS declined almost too basal level after the treatment of cells at 200 μM (p=0.028) (Figure 3). Whereas, ROS production in HT-29 cells was found to be at the peak after treatment with 1μM concentration of B(α)P. However, the generation of ROS started declining after 10 μM and reached to basal level at 200 mM concentration (p=0.032) (Figure 3).
Figure 3: (A) Effect of B(α)P treatment on mtROS production (by DHR123 fluorescence dye) in HCT-15 cells (B) Effect of B(α)P treatment on mtROS production (by DHR123 fluorescence dye) in HT-29 cells. Both the cell lines were treated with different concentrations of B(α)P for 24 hours and 48 hours including 30 minutes with fluorescence dye at the end phase. Cells were then washed with sterile PBS, and de-adhered for final analysis. Results are expressed as mean ± SD of three assays. *p< 0.05; *B(α) P treated cells compared with respective controls.
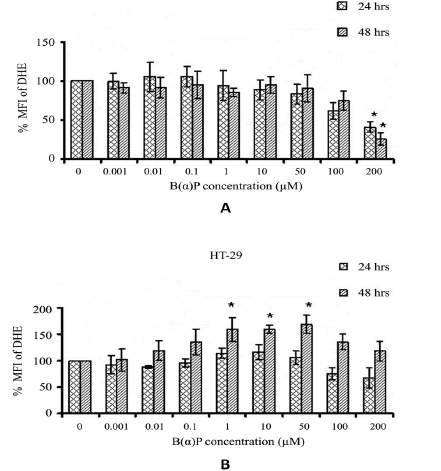
The SOR production in HCT-15 cells after the exposure of various concentrations of B(α)P for 24 hours and 48 hours are shown in Figure 4. SOR production significantly decreased after the treatment of cells at 200 µM of B(α)P concentration as compared to the basal level (p=0.022). We observed no change in the SOR production in HT-29 cells at 24 hours after treatment with B(α)P concentrations. However, at 48 hours SOR production was significantly increased after treatment with B(α)P at 1 µM to 50 μM concentration as compared to basal level (p=0.034) (Figure 4).
Figure 4: Effect of B(α)P treatment on SOR production (by DHE fluorescence dye) in HCT-15 cells (B) Effect of B(α)P treatment on SOR production (by DHE fluorescence dye) in HT-29 cells . Both the cell lines were treated with different concentrations of B(α)P for 24 hours and 48 hours including 30 minutes with fluorescence dye at the end phase. Cells were then washed with sterile PBS, and de-adhered for final analysis. Results are expressed as mean ± SD of three assays. *p<0.05; *B(α)P treated cells compared with respective controls
PLA2 mRNA expression in HCT-15 and HT-29 cells
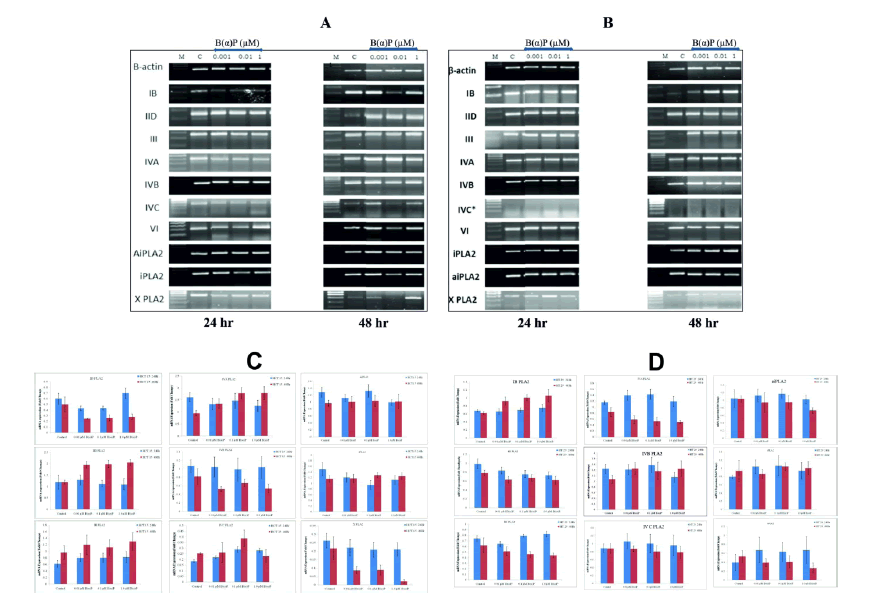
mRNA expressions of secretory Phospholipase A2 (sPLA2), cytosolic Phospholipase A2 (cPLA2) and independent Phospholipase A2 (iPLA2) groups were evaluated in the cells after challenging them with selected concentrations of B(α)P. PLA2 gene expression at 24 hours and 48 hours of treatment with the B(α)P in HCT-15 and HT-29 are shown in Figure 5. Group IVC PLA2 was not detectable in HT-29 cells at the control level as well as after treatment with B(α)P concentrations. Whereas, it was expressed in HCT-15 cells after treatment with B(α)P concentrations. The other groups, like PLA2 IB of sPLA2 family, was upregulated significantly from 0.62 ± 0.03 (control) to 0.92 ± 0.1, 1 ± 0.07, and 1.1 ± 0.15 after treatment with 0.01 µM, 0.1 µM, and 1.0 µM B(α)P concentrations respectively in HT-29 cells at 48 hours (p=0.028). While such effects were not observed in HCT-15 cells after treatment with B(α)P at 48 hr. However, the IID PLA2 group was upregulated significantly. The relative gene expression after B(α)P treatment at 0.01 µM, 0.1 µM, and 1.0 µM B(α)P was upregulated significantly from 1.2 ± 0.07 (control) to 1.8 ± 0.21, 2 ± 0.13, and 2 ± 0.15 respectively in HCT-15 cells (p=0.025). While such effects were not observed in HT-29 cells after treatment with B(α)P at 48 hours. The relative gene expression of PLA2 group IVA was significantly upregulated after treatment with 0.01, 0.1, and 1.0 µM B(α)P from 0.9 ± 0.1 (control) to 1.4 ± 0.19, 1.8 ± 0.24, and 1.8 ± 0.27 respectively in HCT-15 cells at 48 hours (p=0.041). All values are given in the form of a grey value of densitometry analysis by image J software. Levels of mRNA expression of III, IVB, IVC, VI, X, aiPLA2 and iPLA2 groups were not affected in the cells after treatment with B(α)P. (Figure 5).
Figure 5: (A) mRNA expression of different groups of isoforms at constitutive level and after treatment with B(α)P for different times (24 hours and 48 hours) in HCT-15 cells (B) mRNA expression of different groups of isoforms at constitutive level and after treatment with B(α)P for different times (24 hours and 48 hours) in HT-29 cells. β-actin was used as an internal control for normalization of mRNA levels. (C) Densitometric quantification of HCT -15 cells (D) Densitometric quantification of HT-29 cells mRNA expression. Experiments were done in triplicates
Effect of silencing of IB, IID, and IVA PLA2 by specific PLA2-siRNA in B(α)P treated colon cells
The upregulation of IB, IID and IVA PLA2 gene expression in the presence of B(α)P was inhibited by siRNA of IB, IID and IVA PLA2 gene in HCT-15 and HT-29 colon cells.
Silencing of gene expression in HT-29 and HCT-15 cell lines by siRNA
Relative gene expression (mean ± SD) of group IB at mRNA levels in siRNA (IB) without and with 0.1 µM B(α)P was found to be, significantly reduced as compared with scrambled siRNA (p=0.035) in HT-29 cells (Figure 6). Relative mRNA expressions of IID in siRNA (IID) without and with 0.1 µM B(α)P were found to be significantly reduced (p=0.025) as compared to scrambled controls in HCT-15 (Figure 6). Relative gene expression of group IVA at mRNA levels in siRNA (IVA) without and with 0.1 µM B(α)P concentration was found to significantly down-regulated (p=0.021) in comparison to scrambled controls in HCT-15 (Figure 6). Thus, a significant inhibition in gene expressions of group IB, IID, and IVA, PLA2 isoforms were observed in the presence of siRNA of specific PLA2 gene (p<0.05).
Figure 6: (A) Real Time PCRanalysis of group IB PLA2 in siRNA transfected HT-29 cells (B) Real time PCRanalysis of Group IID PLA2 transfected HCT-15 cells (C) Real Time PCR analysis group IVA PLA2 transfected HCT-15 cells with scrambled control, positive control and positive control along with B(α)P exposure for 48 hours. Β-actin was used as an internal control for normalization of mRNA levels. Relative expression represented by fold change. Results are expressed as mean±SD of three assays. *p<0.05; *positive control cells and B(α)P treated cells compared with scrambled control
Effect of group IB, IID, and IVA PLA2 gene silencing
Cell viability
Effects of B(α)P on cell viability after silencing the specific PLA2 genes at 48 hours. Figure 7 shows cell viability in group IB PLA2 transfected cells using IB siRNA. Viability of cells in scrambled siRNA control and siRNA (IB) without and with 0.1 µM B(α)P were found to be comparable respectively as compared to scrambled control in HT-29 cells (Figure 7). The percentage of cell viability after knockdown with IID PLA2 siRNA or scrambled siRNA control and siRNA (IID) without and with 0.1 µM B(α)P were found to be not significantly reduced as compared to scrambled control in HCT-15 cells (Figure 7). The cell viability in HCT-15 cells after the suppression of group IVA PLA2 gene using siRNA of scrambled siRNA control and siRNA (IVA) without and with 0.1 µM B(α)P were found to be comparable as compared to scrambled control (Figure 7). It was worth noting that values after treatment with B(α)P were statistically non-significant to scrambled control.
Figure 7: (A) Effect of B(α)P for 48 hours on cell viability (MTT assay) of HT-29 cells transfected with siRNA of PLA2 IB groups (B) Effect of B(α)P for 48 hours on cell viability (MTT assay) of HCT-15 cells transfected with siRNA of PLA2 IID groups (C) Effect of B(α) P for 48 hours on cell viability (MTT assay) of HCT-15 cells transfected with siRNA of PLA2 IVA groups. Results are expressed as mean ± SD of three separate assays. ScrCont: Scrambled control
Intracellular ROS
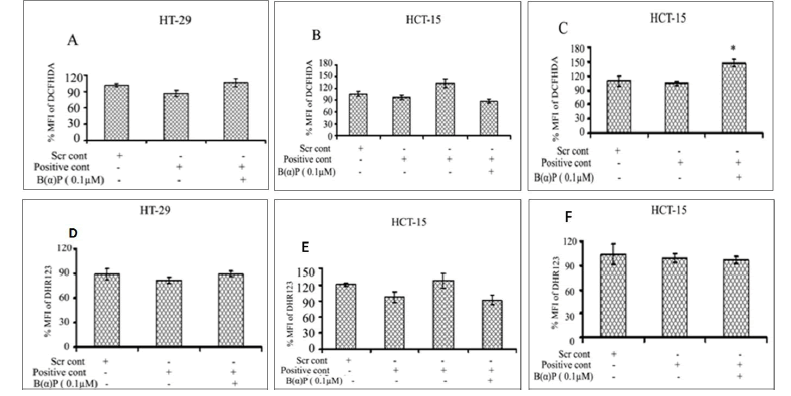
ROS formation in the presence of group IB, IID and IVA siRNA in both cell lines at 48 hours is shown in Figure 8. Total ROS production in scrambled siRNA control and siRNA (IB) without and with 0.1 µM of B(α)P in HT-29 cells were found to be 101% ± 3.1%, 86% ± 5.5% and 106% ± 7.3% respectively (Figure 8). ROS production in HCT-15 cells in the presence of scrambled siRNA control and siRNA (IID) without and with 0.1 µM of B(α)P siRNA (IID) were found to be 106% ± 6.6%, 97% ± 5.1% and 88% ± 4.6% respectively (Figure 8). Whereas, ROS production in the presence of group IVA siRNA with exposure to 0.1 µM B(α)P were 109% ± 10.3%, 104% ± 4.1%, and 147% ± 6.9% in scrambled siRNA control and siRNA (IVA) without and with 0.1 µM of B(α)P respectively as compared to scrambled control in HCT-15 cells (Figure 8). A statistically significant increase (p=0.014) in ROS production was found only in IVA transfected cells when challenged with 0.1 µM B(α)P. Figure 8 shows mitochondrial ROS production after down-regulation of the PLA2 gene using siRNA and treating the cells with 0.1 µM B(α)P at 48 hours. ROS production in HT-29 cells transfected with group IB PLA2 gene using siRNA and treated to 0.1 µM B(α)P was 89% ± 6.4%, 81% ± 3.7%, and 89% ± 3.4% in scrambled siRNA control and siRNA (IB) without and with 0.1 µM of B(α)P respectively (Figure 8). Whereas ROS production in the presence of group IID PLA2 siRNA in HCT-15 cells was 121% ± 2.8%, 97% ± 10.3% and 92% ± 8.6% in scrambled siRNA control and siRNA (IID) without and with 0.1 µM of B(α)P respectively (Figure 8). On the other hand, ROS production in the presence of group IVA siRNA with exposure to 0.1 µM B(α)P was 104% ± 12.5%, 99% ± 5.2%, and 96% ± 4.2% in scrambled siRNA control and siRNA (IVA) without and with 0.1 µM of B(α)P respectively in HCT-15 cells (Figure 8). However, all the values in the experimental groups mentioned above were statistically non-significant to scrambled control.
Figure 8: Effect of B(α)P for 48 hours on ROS production (by DCFH-DA fluorescence dye) of HCT-15 and HT-29 cells transfected with siRNA of PLA2 (A) IB (B) IID (C) IVA groups and on mitochondrial ROS production (by DHR123 fluorescence dye) (D) IB (E) IID (F) IVA groups. Both the cell lines were treated with concentrations of 0.1 μM B(α)P for 48 hours including 30 minutes with fluorescence dye at the end phase. Cells were then washed with sterile PBS, and de-adhered for final analysis. Results are expressed as mean ± SD of three separate assays. ScrCont: Scrambled control. *p<0.05; *positive control cells with B(α)P treated cells compared with scrambled control.
SOR production
Relative SOR production in the presence of group IB, IID and IVA siRNA in both cell lines at 48 hr is shown in Figure 9. Relative SOR production in HT-29 cells transfected with group IB PLA2 gene siRNA treated with 0.1 µM B(α)P in scrambled siRNA control and siRNA (IB) without and with 0.1 µM of B(α)P were found to be 92% ± 4.9%, 103% ± 9.6% and 116% ± 3.5% respectively (Figure 9). Whereas, SOR production in scrambled siRNA control and siRNA (IID) without and with 0.1 µM of B(α)P was 91% ± 8.0%, 86% ± 6.7%, and 90% ± 3.6% respectively in HCT-15 cells (Figure 9). However, the SOR production in HCT-15 cells in the presence of siRNA (IVA) was 96% ± 12.0%, 73% ± 10.7% and 69% ± 13.0% in scrambled siRNA control and siRNA (IVA) without and with 0.1 µM of B(α)P respectively (Figure 9). Like other parameters such as cell viability, ROS, mitochondrial ROS, etc in this case also the changes were non-significant to scrambled control.
Figure 9: Effect of B(α)P for 48 hours on SOR production (by DHE fluorescence dye) of HCT-15 and HT-29 cells transfected with siRNA of PLA2 (A) IB (B) IID (C) IVA groups. Both the cell lines were treated with concentrations 0.1 μM B( )P for 48 hours including 30 minutes with fluorescence dye at the end phase. Cells were then washed with sterile PBS, and de-adhered for final analysis. Results are expressed as mean ± S D of three separate assays. ScrCont: Scrambled control
Discussion
CS continues to remain one of the most important health hazards and it contributes extensively too many diseases including respiratory disorders characterized by inflammatory changes in the lungs [10, 11]. It is involved in many other cancers like pharynx, larynx, esophagus, etc. various studies also suggested the relationship between smoking and stomach, liver and colon cancer [12, 13]. However, the molecular and cellular mechanism involved in the pathogenesis of smoking-related colon cancer remains unknown.
CS is a very complex, multi-factorial stimulus with over 5300 identified constituents [14]. Approximately 100 carcinogens, co-carcinogens, mutagens, and/or tumor promoters are present in CS [15]. One of the most prominent carcinogens in burned as well as, unburned tobacco, is B(α) P [16]. The complex changes in cellular functions, morphology and gene expression caused by CS constituents that are initiators as well as promoters of carcinogenesis, involve a combination of direct and indirect effects on cells and their components [17]. We found that treatment with B(α)P resulted in a significant change in cell shape and size in both the cell lines (HCT-15 and HT-29 cells). There was prominent fragmentation, loss of cohesiveness, irregular shape and the cells appeared in clumps. Our present study is in consonance with an earlier report, on MCF-10A and MCF-12A cell lines which also showed these cellular changes after CSC treatment. Cells were reported to become more elongated and spindle-shaped after exposure to cigarette smoke [18]. These morphological changes may be due to multiples factors like altered cell membrane integrity caused by increased formation of ROS leading to changes in cytotoxicity, proliferation and apoptosis.
Cytotoxicity, an important factor in understanding the mechanism of action of chemicals on cells and tissues, may modulate the activity of other agents, including free radicals, oxidants, irritants and genotoxins [19]. These intracellular moieties have been reported to induce adverse effects in the body [20]. In this study, we observed that no cytotoxic effects of B(α)P at concentrations below 1 µM in HCT-15 and below 50 µM in HT-29 cells, but at higher concentrations, the cell viability decreased significantly. Similar observations have been reported earlier on the effects of B(α)P in other cell lines[21].
Cellular levels of ROS reflect a delicate balance between ROS production and detoxification. Despite the existence of such well-coordinated cellular ROS detoxification systems, the uncontrolled ROS production may overwhelm these defense mechanisms. Many previous studies have shown that aqueous cigarette tar extracts increase cellular production of ROS leading to increased pro-inflammatory gene expressions [22-24]. As cells respond to various agents and mediate the regulation of ROS through different mechanisms of H2O2, superoxide and mitochondrial ROS generation. It was of interest to elucidate the main mechanism of ROS mediated damage towards the B(α)P in the colon cells. Hence, we used various fluorescent probes that detect the intracellular H2O2 using DCFH-DA, superoxide using DHE and mitochondrial ROS using DHR123. Our results clearly show that PLA2 IVA is identified in the intracellular H2O2 mediated oxidative stress. In this study, we have found that B(α)P induced intracellular ROS in both the colon cell lines (HCT-15 and HT-29). However, the extent of ROS production was more in HT-29 cells than in HCT-15 cells. Interestingly the induction of ROS, in HT-29 cells which had the origin from colorectal, human primary carcinoma of the colon was more active in producing ROS [25]. As intracellular ROS could function upstream or downstream of the mitochondria, we also determined the mitochondrial ROS production in these cells after exposure with B(α)P. It was found that the extent of generation of ROS in mitochondria of HT-29 cells was less as compared to HCT-15 cells. Besides this the extent of mitochondrial ROS generation in HT-29 cell was much less than the overall stimulation whereas, in HCT-15 cells the increase in overall and mitochondrial production of ROS was much less than in HT-29 cells. The possible explanation for such an observation could be the variation in mitochondrial antioxidant defense (enzymatic and non-enzymatic) system in the two cell lines, one of which (HT-29) is more resistant than the other (HCT-15) to the toxic materials.
Another pathway of regulating the superoxide radicals is through ubiquinol (QH2) which has been shown to act as a reducing agent in the elimination of various peroxides in the presence of succinate [26]. Though like total ROS, SOR production by B(α)P was more in HT-29 than HCT-15 cells, the mitochondrial ROS production was more in HCT-15 cells. This finding indicates of better antioxidant status of HT-29 cells and is likely to be related to the stability of cells in response to toxic material B(α)P. If we closely look at the cell viability and ROS generation at the concentrations of Benzo pyrene used, both the cell lines showed the ROS generation using all the fluorescent dyes. However, the concentrations at which both the cell lines showed ROS generation was at 0.1uM for DCFH-DA and DHR123. It is clear from this result that the initiation of ROS starts at 0.1uM but to have the toxicity effect the dose of 0.1 µM B(α)P is not sufficient to elicit the damaging effect and only happens beyond the dose of 1 µM. In this study we observed that the exposure to B(α)P in colon epithelial cells induced an increase in the expression of phospholipase A2. sPLA2 isoforms produce inflammatory mediators that stimulate the expression of ICAM-1. Recently several studies have looked beyond the role of phospholipase enzymes in inflammation to probe their contribution to the pathogenesis of cancer [27-29]. As per our knowledge there is no study that has determined the status of PLA2 isoforms expression in colon cells after exposure with B(α)P. Several studies have reported the increased expression of various PLA2 isoforms in some cancers including colon cancer [30]. Isoforms was different in HCT-15 and HT-29 cells. Group IVC PLA2 was not expressed in HT-29 cells at the control level as well as after treatment with B(α)P. Whereas, it was expressed in HCT-15 cells after treatment with B(α)P. PLA2 IID and IVA group of sPLA2 family was unregulated significantly in treated groups when compared to control in HCT-15 cells whereas group IB PLA2 increased significantly with B(α)P treatment in HT-29 cells. Levels of mRNA expression of III, IVB, IVC, VI, X, aiPLA2 and iPLA2 groups were not affected in the cells after treatment with B(α)P.
Many previous studies documented the PLA2s such as cPLA2, sPLA2 group IIA, sPLA2 group IID and sPLA2 group X has been involved in colon tumor development [31, 32]. Our findings are similar to that of Valentine et al., to some extent, wherein they found over-expression of cPLA2 in 49% of colon carcinomas patients as well as in four colon cancer cell lines [33]. These results coincide with the elevated expression of cPLA2α in human colon adenocarcinoma [34]. On the other hand, cPLA2 expression has been reported to be was diminished in azoxymethane-induced mouse colon tumors and knock-out of cPLA2 enhanced colon tumor development [35]. But effects of PLA2-knockdown observed in this study on CSC- and B(α)P-induced changes may be due to reversal of the process of cell morphology, cell viability, cell proliferation, cell membrane integrity, cell apoptosis, ROS production, mitochondrial ROS production and SOR formation in transfected cells by specific PLA2 siRNA as well as in cells treated with selected concentration of B(α)P. In HCT-15 and HT-29 cells. The underlying molecular mechanism involved in this process appears to be through sPLA2 (group IID) and cPLA2 (group IVA) in HCT-15 cells, whereas it occurs through sPLA2 (group IB) in HT-29 cells. This observation indicates that sPLA2 isoforms are commonly affected PLA2 in both these cell lines and inhibition of this isoform by the specific agents may play an important role in arresting the growth of colon cancer cells Whereas, a study on cPLA2deficiency is associated with increased ulceration in small intestinal [36].
Conclusion
sPLA2 appears to be the most common form of PLA2 playing a role in the deleterious effects of B(α)P in HCT-15 and HT-29 colon cells.
Acknowledgments
Authors would like to acknowledge Indian Council of Medical Research, Govt. of India, New Delhi, for the award of Senior Research Fellowship (IRIS ID: 2010-09550) to Sanjeev Kumar Sharma.
Conflicts Of Interest
The authors declare that they have no competing interests.
REFERENCES
- Ferlay J, Shin HR, Bray F, et al. Estimates of worldwide burden of cancer in 2008: GLOBOCAN 2008. Int J Cancer. 2010;127(12):2893-917.
- Chan EWC, Soon CY, Tan JBL, et al. Ursolic acid: An overview on its cytotoxic activities against breast and colorectal cancer cells. J Integr Med. 2019;17:155-160.
[Google Scholar ] [ CrossRef]
- Agen B, Maas LM, Zwingmann IH, et al. B(α)P adduct formation and induction of human epithelial lung cell transformation. Environ Mol Mutagen 2001;30:287-292.
[Google Scholar] [CrossRef ]
- Kokotou MG, Limnios D, Nikolaou A. Inhibitors of phospholipase A 2 and their therapeutic potential: An update on patents 2012-2016. Expert Opin Ther Pat. 2017;27(2):217-225.
- Schewe M, Franken PF, Sacchetti A, et al. Secreted phospholipases a2 are intestinal stem cell niche factors with distinct roles in homeostasis, inflammation, and cancer. Cell Stem Cell. 2016;19(1):38-51.
- Sharma U, Pal D, Singh SK, et al. Reduced L/B/K alkaline phosphatase gene expression in renal cell carcinoma: plausible role in tumorigenesis. Biochimie 2014;104:27-35.
- Dikalov SI, Harrison DG. Methods for detection of mitochondrial and cellular reactive oxygen species. Antioxid Redox Signal. 2014;20:372-382.
- Sharma U, Pal D, Prasad R. A novel role of alkaline phosphatase in the ERK1/2 dephosphorylation in renal cell carcinoma cell lines: A new plausible therapeutic target. Biochimie 2014;107B:406-409.
- Pal D, Sharma U, Singh SK, et al. Over-expression of telomere binding factors (TRF1 & TRF2) in renal cell carcinoma and their inhibition by using siRNA induce apoptosis, reduce cell proliferation and migration in vitro. PLOS One 2015;10:e0115651.
- Maestrelli P, El Messlemani AH, De Fina O, et al. Increased expression of heme oxygenase (HO)-1 in alveolar spaces and HO-2 in alveolar walls of smokers. Am J Respir Crit Care Med. 2001;164:1508-1513.
- Lavigne MC, Eppihimer MJ. Cigarette smoke condensate induces MMP-12 gene expression in airway-like epithelia. Biochem Biophys Res Commun. 2005; 330:194-203.
- Edgar SL Liu, Yi-Ni Ye, Vivian Y Shin, et al. Cigarette smoke exposure increases ulcerative colitis-associated colonic adenoma formation in mice. Carcinogenesis. 2003; 24:1407-1413.
- Helen Pui, Shan Wong, Le Yu, et al. Nicotine promotes colon tumor growth and angiogenesis through b-adrenergic activation. Toxicol Sci 2007;97:279–287.
- Rodgman A, Perfetti TA. The chemical components of tobacco and tobacco smoke. CRC press; 2008.
- Smith CJ, Perfetti TA, Garg R, et al. IARC carcinogens reported in cigarette mainstream smoke and their calculated log P values. Food Chem Toxicol. 2003;41:807-817.
- Hoffmann D, Wynder EL. Selective reduction of the tumorigenicity of tobacco smoke. Experimental approaches. Natl Cancer Inst Monogr. 1968;28:151-172.
- Wu WK, Cho CH. The pharmacological actions of nicotine on the gastrointestinal tract. J Pharmacol Sci. 2004; 94:348-358.
- Di Cello F, Flowers VL, Li H, et al. Cigarette smoke induces epithelial to mesenchymal transition and increases the metastatic ability of breast cancer cells. Mol Cancer. 2013;12(1):1-1.
- Bombick DW, Ayres PH, Putnam K, et al. Chemical and biological studies of a new cigarette that primarily heats tobacco. Part 3. In vitro toxicity of whole smoke. Food Chem Toxicol 1998;36(3):191-197.
- Waldren CA, Vannais DB, Knowlton MS, et al. The role of glutathione in the toxicity of smoke condensates from cigarettes that burn or heat tobacco. Free Radic Biol Med. 2001;30(12):1400-1406.
- Bishop E, Theophilus EH, Fearon IM. In vitro and clinical studies examining the expression of osteopontin in cigarette smoke-exposed endothelial cells and cigarette smokers. BMC Cardiovasc Disord 2012;12(1):1-0.
- Haller H. Endothelial function. Drugs. 1997;53(1):1-0.
- Ambrose JA, Barua RS. The pathophysiology of cigarette smoking and cardiovascular disease: an update. J Am Coll Cardiol 2004;43(10):1731-1737.
- Bagi Z, Koller A. Lack of nitric oxide mediation of flow- dependent arteriolar dilation in type diabetes is restored by sepiapterin. J Vasc Res. 2003;40(1):47-57.
- Von Kleist S, Chany E, Burtin P, et al. Immunohistology of the antigenic pattern of a continuous cell line from a human colon tumor. Natl Cancer Inst 1975;55(3):555-560.
- Eto Y, Kang D, Hasegawa E, et al. Succinate-dependent lipid peroxidation and its prevention by reduced ubiquinone in beef heart submitochondrial particles. Arch Biochem Biophys. 1992,295(1):101-106.
- Mauchley D, Meng X, Johnson T, et al. Modulation of growth in human esophageal adenocarcinoma cells by group IIa secretory phospholipase A2. J Thorac Cardiovasc Surg. 2010;139(3):591-599.
- Sadaria MR, Meng X, Fullerton DA, et al. Secretory phospholipase A2 inhibition attenuates intercellular adhesion molecule-1 expression in human esophageal adenocarcinoma cells. Ann Thorac Surg. 2011;91(5):1539-1545.
- Jessica AY, Sadaria MR, Meng X, et al. Lung cancer cell invasion and expression of intercellular adhesion molecule-1 (ICAM-1) are attenuated by secretory phospholipase A2 inhibition. J Thorac Cardiovasc Surg. 2012;143(2):405-411.
- Dong M, Johnson M, Rezaie A, et al. Cytoplasmic phospholipase A2 levels correlate with apoptosis in human colon tumorigenesis. Clin Cancer Res. 2005;11(6):2265-2271.
- Morioka Y, Ikeda M, Saiga A, et al. Potential role of group X secretory phospholipase A2 in cyclooxygenase-2-dependent PGE2 formation during colon tumorigenesis. FEBS Lett. 2000;487(2):262-266.
- Murakami M, Yoshihara K, Shimbara S, et al. Group IID heparin‐binding secretory phospholipase A2 is expressed in human colon carcinoma cells and human mast cells and up‐regulated in mouse inflammatory tissues. Eur J Biochem. 2002;269(11):2698-707.
- Valentin E, Lambeau G. Increasing molecular diversity of secreted phospholipases A2 and their receptors and binding proteins. Mol Cell Biol Lipids. 2000;1488(1-2):59-70.
- Lim SC, Cho H, Lee TB et al. Impacts of cytosolic phospholipase A2, 15-prostaglandin dehydrogenase, and cyclooxygenase-2 expressions on tumor progression in colorectal cancer. Yonsei Med J. 2010;51(5):692-699.
- Ilsley JN, Nakanishi M, Flynn C, et al. Cytoplasmic phospholipase A2 deletion enhances colon tumorigenesis. Cancer Res. 2005;65(7):2636-2643.
- Adler DH, Cogan JD, Phillips JA, et al. Inherited human cPLA 2α deficiency is associated with impaired eicosanoid biosynthesis, small intestinal ulceration, and platelet dysfunction. J Clin Investig. 2008;118(6):2121-2131.


