The study of potential toxic metals in dumpsites using surface soils and Talinum triangulae (water leaves) as environmental pollution indicators
2 Environmental Health Department, McGill University Health Centre, Obafemi Awolowo University, Ile Ife, Nigeria
Received: 26-Nov-2017 Accepted Date: Mar 27, 2018; Published: 10-Apr-2018
Citation: Adebiyi PE, Olukoi G. The Study of potential toxic metals in dumpsites using surface soils and Talinum triangulae (water leaves) as environmental pollution indicators. J Environ Chem Toxicol. 2018;2(2):41-7.
This open-access article is distributed under the terms of the Creative Commons Attribution Non-Commercial License (CC BY-NC) (http://creativecommons.org/licenses/by-nc/4.0/), which permits reuse, distribution and reproduction of the article, provided that the original work is properly cited and the reuse is restricted to noncommercial purposes. For commercial reuse, contact reprints@pulsus.com
Abstract
This study aimed at investigating the levels of potential toxic metals in dumpsites using surface soils and Talinum triangulae (water leaves) as environmental pollution indicators. The soil and Talinum triangulae samples collected from dumpsites in Ile Ife, Nigeria were analyzed to ascertain the pollution level of the dumpsite. The elemental composition of the two set of samples were determined using Energy dispersive x-ray fluorescence (EDXRF) spectroscopy. Twelve elements (Ca, Fe, K, As, Zn, Sr, Pb, Mn, Cu, Ti, Cr and Zr) were detected in the soils, while Ca, Ni, Sr, K, Pb, Mn, Zn, Cu, Fe, Ti, Cr and Zr were identified in the Talinum triangulae. The elemental concentration, geo-accumulation index (Igeo), concentration ratio (CR) and correlation among the plant/soil samples, and elements were determined using a combination of cross plot and cluster analyses. The result of CR showed that the plant has highest uptake ability for Cr and least for Sr. T-test results indicated no significant difference in concentrations of all the metals in the elemental concentrations of the dumpsite soil/plant samples based on their T-test values. Cross plot analysis result (R2=0.791) of the soil/plant samples suggested inter-element correlations between them. Elemental clustering analysis result showed five major groups which were also moderately correlated with one another, indicating similar chemical affinity or same source or both. The study concluded that the dumpsites were polluted with respect to most of the analyzed metals based on their concentrations. It is recommended that dumping of waste on an open space and citing of dumpsites at backyards should also be greatly discouraged due to its ill-health effects.
Keywords
Dumpsite; EDXRF; Metal; Pollution indicator; Soil; Talinum triangulae
The open dumping disposal method is the main technique that is used in disposing municipal solid waste in many parts of Nigeria and African nations. This has posed a very serious problem of environmental pollution. It has equally increased the number of studies carried out on potentially toxic element concentration and has also heighten our concern to reduce the level of heavy metal concentration by remediating the soil since we cannot overlook the harm caused by the presence of these heavy metals in the soil.
These heavy metals (Pb, Fe, Hg, Cd, Mn, As, Cu, Co, Cr, Zn, Mo, Ni, etc.) are introduced into the food chain by the plant through the process of diffusion by the xylem and phloem tissues. They take up these metals either as mobile ions in the soil solution or through the leaves of the plant. These heavy metals are bio-accumulated in the leaves, stem, fruits, grains and the root of the plant. Higher concentration of heavy metals in the soil can result in higher level of uptake by the plant [1]. Soil pH is a crucial factor which affects the availability of metals in the soil. Metal mobility decreases with increasing soil pH due the precipitation of hydroxides, carbonates or as a result of the formation of insoluble organic complexes [2]. The rate of metal uptake by plant could be influenced by factors such as metal species, plant species, plant age and part [1].
At a very low concentration, some heavy metals are not harmful but useful to life, but when ingested at an ample quantity, they produce toxicity. There are some metals whose study and control is of great importance, this is because they produce toxicity either at low concentration or due to their pervasiveness in the ecosystem. Unlike organic pollutants that are biodegradable, heavy metals are not biodegradable but can only be transformed from one oxidation state to the other or from one organic complex form to another [3,4]. At sufficient concentration, exposure to these heavy metals may cause decrease mental ability, weakness (especially hands), abdominal cramps, diarrhea, and anemia. It can also affect the blood forming mechanism, kidney and the peripheral nervous system. It causes permanent kidney and brain damage or causes kidney or lungs diseases; they are also carcinogenic [5].
In animals, these heavy metals produce their toxicity by forming complexes or ligands with organic compounds, therefore modifying these biological molecules and making them lose their ability to perform their functions properly, in so doing leads to the malfunctioning of the cell and likewise to the death of the affected cell or even the organism. The most common group that is involved in ligand formation is the NSO (nitrogen, sulphur and oxygen) group. When the metals bind to these groups, they may inactivate important enzymes system or affect the protein structure [5].
Application of soil from dumping site to agricultural farm have been a long time practice because the organic waste provide nutrients for increased plant growth and such positive effect will likely encourage continued land application of this waste [6,7]. Municipal waste also increases the pH, cation, CO2, nitrogen, chloride contents, exchange capacity, percentage base saturation and organic matter [6] and decreases the oxygen concentration of the soil. Excessive waste will also increase the concentration of the heavy metal concentration in the soil and this will cause more harm than good in the food chain.
As a result of the depreciation of the agricultural farm land, farmers have been advised to use soil found on dumpsite to increase the fertility level of their farmland and to increase the soil structure, but not only does the dumpsite soil increase the soil fertility level and structure, it pollutes the soil by increasing the concentration of the toxic heavy metals which are not only carcinogenic but causes other health hazards. Dumpsites are usually located within residential areas and this is environmentally unfriendly. The study of potential toxic metals in dumpsites using surface soils and Talinum triangulae (water leaves) as environmental pollution indicators will therefore provide information on the adverse effects of dumpsites.
Experimental
Sample collection and preparation
Five soil samples were collected randomly each at two locations namely Apollo and OAU dumpsites in Ile-Ife (Figure 1). At each sampling point, soil sample at depth 0-5 cm was collected using a clean stainless steel Hand trowel after the decomposing materials had been removed. After sampling, all debris were discarded, the samples were collected and wrapped in aluminum foil and then air dried at room temperature in the laboratory but well covered with plain sheets of paper to avoid contamination with air particulates/ fugitive dusts for two weeks. In the laboratory, the samples were then crushed and pulverized using agate mortar. The pulverized samples were mixed thoroughly and sub-sampled by coning and quartering to provide composite and representative samples for analysis [8,9]. The pulverized samples were used for the determination of soil elemental composition. Five samples of Talinum triangulae (Water leaf plant) were collected from each of the two dumpsites from where soil samples were collected. The samples were washed in distilled water in order to remove superficial dust. It was then dried at 60°C for 48 h in oven. The dried samples were ground with laboratory mill. The powdered plant samples were put in polythene sachets (7 mm-10 mm) and sealed to avoid any loss of material and contamination. Soil [5] and plant [5] control samples were collected about 100 m away from the each of the two study areas and the samples were treated using the same protocols as test samples [8,10]. The pulverized soil and plant samples were put in sachets and taken to Centre for Energy Research Development (CERD), Obafemi Awolowo University, Ile Ife, Nigeria for elemental analysis using Energy Dispersive X-ray Fluorescence (EDXRF) Spectroscopy.

Figure 1: Picture showing OAU dumpsite, Ile-Ife, Nigeria
Data analysis
The statistical tools include: t-test, Cross Plot, Cluster, Geo-accumulation Index, Pollution Index, Histograms and Graph.
T-test
In the t-test analysis, comparison of the concentrations of the analyzed elements in the dump site and control soil and plant samples was done. The value of t was computed by employing the expression:
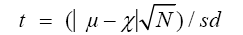
and then compared with the tabulated value of t from statistical table at 95% confidence interval.
Where, N=Number of Samples; S.D=Standard Deviation; t=T-test Value; μ=Control or True Value; χ=Experimental Mean Values, respectively.
The t values were calculated to indicate apparent significant difference from statistical point of view, between the concentration of each element in the dumpsite and control soil samples.
If texperimental>ttheoretical, it is concluded that there is significant difference between the μ and χ, otherwise it is in-significant [11].
Cluster
Cluster analysis is a multivariate analysis technique that seeks to organize information about variables so that relatively homogeneous groups or “clusters,” can be formed. Cluster analysis classifies a set of observations into two or more mutually exclusive unknown groups based on combinations of interval variables. The purpose of cluster analysis is to discover a system of organizing observations, where members of the groups share properties in common. It is cognitively easier for people to predict behavior or properties of group members based on group membership, all of whom share similar properties. The cluster analysis was performed using the Statistical Package for Social Scientist (SPSS) using the analyzed elements as variables.
Graphs
Graph is a diagram that shows relationships between numbers. Graphs arrange numerical information into a picture from which it is often possible to see overall patterns or trends in the information. Bar Chart is used to compare each element in the test with the control samples. It is a way of displaying statistical data using horizontal or vertical bars. The heights or lengths of the bars are proportional to the quantities they represent. This was carried out using Microsoft Excel.
Cross plots
A cross plot (CP) is a graph which shows all those times at which a state in one dynamical system occurs simultaneously in a second dynamical system. With other words, the CP reveals all the times when the phase space trajectory of the first system visits roughly the same area in the phase space where the phase space trajectory of the second system is.
Concentration ratio (CR)
The concentration ratio (CR) was calculated to determine the uptake ability for the element by the plant to know if the soil is not the only source of contribution of the element. Similar to Enrichment Factor (EF), the CR has been use to systemize the relationship between the soil and the plants. By definition, the CR is given by:
CR=(Concentration of element in Plant)/(Concentration of element in Soil)
CR=(Cx) plant/(Cx)soil
Where (Cx) plant and (Cx) soil are the concentration of the element in the plant and soil respectively. It is agreed in principle that if the value of CR is greater than 0.9, it implies that the vegetation sample has high uptake ability for the element or indicates that the soil is not the only source of contribution of the element [10].
Geo-accumulation index (I-geo)
Geo-accumulation index (I-geo) values for the elements were also calculated using the equilibrium equation [12,13]:
I-geo=Log2 (Cn/1.5Bn)
Where, Cn is the measured mean concentration of the element in the soil samples; Bn is the background value and 1.5 is the background matrix correction factor due to lithogenic effects (Table 1).
| Value | Class | Grade/Pollution Index |
|---|---|---|
| I-geo = 0 | 0 | Practically Unpolluted (PU) |
| 0<I-geo<1 | 1 | Unpolluted (U) – Moderately Polluted (MP) |
| 1<I-geo<2 | 2 | Moderately Polluted (MP) |
| 2<I-geo<3 | 3 | Moderately Polluted (MP) – Heavily Polluted (HP) |
| 3<I-geo<4 | 4 | Heavily Polluted (HP) |
| 4<I-geo<5 | 5 | Heavily Polluted (HP) – Very Heavily Polluted (VHP) |
| I-geo>5 | 6 | Very Heavily Polluted (VHP) |
Table 1: Geo-accumulation index/pollution intensity
Results and Discussion
Table 2 presents the concentrations of the metals detected in the dumpsite and control soils. Twelve elements were detected in the dumpsite soils viz; Ca, Fe, K, Ti, Cu, As, Cr, Zn, Zr, Sr, Mn and Pb; the same element were detected on the control soil with the exception of As. The most abundant element detected in the dumpsite soil samples is K, with mean concentration of 1774.57 μg/g, followed by Fe with a mean concentration of 1148.61 μg/g while As has the least concentration of value 22.34 μg/g. It should be noted that As is not detected in the control soils. This should be worrisome, since As has hazardous effect on health. Concentration of the As in the soils is as a result of the paint bucket, wood (arsenic is used as finishes to preserve wood), alloy of arsenic while the high concentration of K is due to it been widely distributed throughout the earth crust. Table 2 is also corroborated by the variation diagrams in Figures 2a and 2b.
| Element | Dump Site Soil Sample | Control Soil sample |
|---|---|---|
| Ca | 172.00-979.19(481.22 ± 314.74) | 121.69 |
| Fe | 907.00-1337.43(1148.61 ± 454.37) | 785.74 |
| K | 1235.00-2431.23(1774.57 ± 990.72) | 1013.35 |
| Ti | 167.56-271.98(204.16 ± 75.62) | 148.49 |
| As | 19.42-27.79(22.34 ± 5.28) | ND |
| Cr | 34.18-63.21(48.76 ± 42.11) | 12.32 |
| Zn | 241.70-348.09(299.41 ± 135.11) | 185.00 |
| Cu | 196.29-267.22(239.44 ± 103.60) | 150.00 |
| Zr | 28.34-76.91(54.57 ± 35.51) | 27.62 |
| Sr | 47.83-340.02(221.03 ± 253.31) | 24.00 |
| Mn | 231.03-281.61(254.24 ± 163.54) | 109.00 |
| Pb | 125.34-291.61(191.18 ± 203.37) | 25.00 |
Table 2: Elemental compositions of the dumpsite and control soils (µg/g)

Figure 2a: Frequency distribution comparing the mean elemental concentrations of the dumpsite and control soils of Ca, Fe, K, Ti, Cu, Zn

Figure 2b: Frequency distribution comparing the mean elemental concentrations of the dumpsite and control soils of As, Cr, Zr, Sr, Mn and Pb
Table 3 present the elemental concentrations of the dumpsite and control plants. As in case of the soils, twelve elements were detected in the plant samples viz; Ca, K. Ti, Sr, Zr, Cr, Mn, Ni, Cu, Pb, Fe and Zn. In the dumpsite plants the most abundant element is K, with mean concentration of 587.22 μg/g. This was followed by Calcium with the mean concentration of 579.55 μg/g. The element with the least concentration is Sr with mean concentration of 18.48 μg/g. This is supported by Figures 3a and 3b.
| Element | Dump Site Plants | Control Plant Sample |
|---|---|---|
| Ca | 569.38-599.18 (579.55 ± 135.76) | 469.58 |
| Fe | 416.21-510.11 (450.84 ± 115.73) | 366.25 |
| K | 520.13-631.40 (587.22 ± 200.32) | 430.93 |
| Ti | 202.74-210.14 (206.01 ± 98.50) | 125.64 |
| As | ND | ND |
| Cr | 85.03-92.03 (88.63 ± 16.78) | 75.23 |
| Ni | 21.23-41.93 (28.76 ± 14.70) | 21.23 |
| Zn | 102.52-190.33 (132.36 ± 69.07) | 93.63 |
| Cu | 221.04-303.21 (250.76 ± 162.89) | 123.07 |
| Zr | 27.10-32.12 (30.45 ± 6.92) | 25.32 |
| Sr | 17.08-19.98 (18.48 ± 4.18) | 15.28 |
| Mn | 98.65-102.21 (101.00 ± 35.27) | 72.25 |
| Pb | 39.49-58.26 (48.74 ± 26.55) | 28.46 |
ND: Not detected
Table 3: Elemental composition of the water leaves (Talinum triangulae) obtained from the dumpsite and control sites (µg/g)

Figure 3a: Frequency distribution comparing the mean elemental concentrations of the dumpsite and control plants of K, Ca, Ti, Fe, Cu, Zn

Figure 3b: Frequency distribution comparing the mean elemental concentrations of the dumpsite and control plants of Cr, Ni, Mn, Sr, Pb and Zr
Figures 4a and 4b shows the frequency distribution comparing the elemental mean concentrations of the dumpsite soils and plants. It is observed that the concentrations of all the elements (except Ca and Cr) are higher in the soils than the plants. The comparatively higher concentration of Ca in the plant than the soil may be due to the fact that the cell wall of plants contains high level of calcium.

Figure 4a: Frequency distribution comparing the mean elemental concentrations of the dumpsite soils and Plants of Ca, Fe, K, Ti, Cu, Zn

Figure 4b: Frequency distribution comparing the mean elemental concentrations of the dumpsite soils and Plants of As, Pb, Cr, Mn, Sr and Zr
The results of the t-test for the elemental concentrations of soil and plant samples are presented in Tables 4-6, respectively. In Table 4, T-test compared two means, viz; the mean concentrations of the elements in the dumpsite soil samples with same elements in the control soil samples. The comparison was based on the null hypothesis [14,15]. The values obtained from the T-test were compared with the standard values 2.776 of ttabulated recommended for 95% confidence levels, at degree of freedom equal to 4 while bearing in mind that the null hypothesis is reject if tcalculated ≥ ttabulated. The elemental parameters showed no significant differences in their values with the exception of As that showed significant difference with tc 9.461. Table 5 compares the elemental concentrations of the dumpsite and control plants. The values obtained from the T-test were compared with the standard values 4.303 of ttabulated recommended for 95% confidence levels, at degree of freedom equal to 2, the elements detected showed no significant difference in their values. Table 6 compares the t-test values for the elemental concentrations of the dumpsite soils and dumpsite plants. The values obtained were compared with the standard values 2.776 of ttabulated recommended for 95% confidence levels, at degree of freedom equal to 4. Only three elements showed significant difference in their values viz: K, Zn and Fe with the tc values 2.680, 2.760 and 3.434, respectively.
| Parameter | t-Test | Remark | |
|---|---|---|---|
| tc | Observation | ||
| Ca | 2.554 | Tc<Tt | N.S.D |
| As | 9.461 | Tc>Tt | S.D |
| Sr | 1.739 | Tc<Tt | N.S.D |
| K | 1.718 | Tc<Tt | N.S.D |
| Pb | 1.827 | Tc<Tt | N.S.D |
| Mn | 1.986 | Tc<Tt | N.S.D |
| Zn | 1.893 | Tc<Tt | N.S.D |
| Cu | 1.942 | Tc<Tt | N.S.D |
| Fe | 1.786 | Tc<Tt | N.S.D |
| Ti | 1.646 | Tc<Tt | N.S.D |
| Cr | 1.935 | Tc<Tt | N.S.D |
| Zr | 1.697 | Tc<Tt | N.S.D |
Tc=T-calculated; Tt=T-tabulated=2.776 at a level=0.05, 95% confidence limit; degree of freedom=4
N.S.D: Not significantly different; S.D: Significantly different
Table 4: Results of t-Test comparing the concentrations of the analyzed elements in the dumpsite and control soil samples
| Elements | t-Test | Remark | ||||||
|---|---|---|---|---|---|---|---|---|
| tc | Observation | |||||||
| Ca | 1.403 | Tc<Tt | N.S.D | |||||
| Ni | 1.145 | Tc<Tt | N.S.D | |||||
| Sr | 1.326 | Tc<Tt | N.S.D | |||||
| K | 1.351 | Tc<Tt | N.S.D | |||||
| Pb | 1.323 | Tc<Tt | N.S.D | |||||
| Mn | 1.412 | Tc<Tt | N.S.D | |||||
| Zn | 0.971 | Tc<Tt | N.S.D | |||||
| Cu | 1.358 | Tc<Tt | N.S.D | |||||
| Fe | 1.266 | Tc<Tt | N.S.D | |||||
| Ti | 1.415 | Tc<Tt | N.S.D | |||||
| Cr | 1.383 | Tc<Tt | N.S.D | |||||
| Zr | 1.284 | Tc<Tt | N.S.D | |||||
Tc=T-calculated; Tt=T-tabulated=4.303 at a level=0.05, 95% confidence limit; degree of freedom=2 N.S.D: Not significantly different; S.D: Significantly different
Table 5: Results of t-Test comparing the elemental concentrations of the dumpsite and control plant samples
| Elements | t-Test | Remark | |
|---|---|---|---|
| tc | Observation | ||
| Ca | 0.699 | Tc<Tt | N.S.D |
| Sr | 1.788 | Tc<Tt | N.S.D |
| K | 2.680 | Tc>Tt | S.D |
| Pb | 1.566 | Tc<Tt | N.S.D |
| Mn | 2.095 | Tc<Tt | N.S.D |
| Zn | 2.760 | Tc>Tt | S.D |
| Cu | 0.244 | Tc<Tt | N.S.D |
| Fe | 3.434 | Tc>Tt | S.D |
| Ti | 0.0547 | Tc<Tt | N.S.D |
| Cr | 2.117 | Tc<Tt | N.S.D |
| Zr | 1.519 | Tc<Tt | N.S.D |
Tc=T-calculated; Tt=T-tabulated = 2.776 at a level=0.05, 95% confidence limit; degree of freedom=4
N.S.D: Not significantly different; S.D: Significantly different
Table 6: Results of t-Test comparing the elemental mean concentrations of the soil and the plant samples
The values of the concentration ratios (CR) of the Talinum triangulae samples are shown in Table 7. The critical value of toxicity is reached when the CR equals 0.9. From the table, it is observed that the plants have high uptake ability for Ca, Ti, Cr and Cu. Chromium has the highest value of 1.818, while Pb had the least value of 0.255; indicating that the plant has highest uptake for Cr and the least for Pb. This may also mean that not only the soils contribute to the concentration of the element in the plant but other sources like the atmosphere. This is seen in the case of Cr which has a higher concentration in the plant compared to the soil.
| Element | Dump Site Soil | Dump Site Plant | Concentration Ratio (CR) |
|---|---|---|---|
| Ca | 481.22 | 579.55 | 1.204 |
| Fe | 1148.61 | 450.84 | 0.393 |
| K | 1013.35 | 587.22 | 0.579 |
| Ti | 204.16 | 206.01 | 1.009 |
| As | 22.34 | - | - |
| Cr | 48.76 | 88.63 | 1.818 |
| Ni | ND | 28.76 | - |
| Zn | 299.41 | 132.36 | 0.442 |
| Cu | 239.44 | 250.76 | 1.047 |
| Zr | 54.57 | 30.45 | 0.558 |
| Sr | 221.03 | 18.48 | 0.0836 |
| Mn | 254.24 | 101.00 | 0.397 |
| Pb | 191.18 | 48.74 | 0.255 |
Table 7: Concentration ratio of the analyzed elements
Table 8 compares the elemental concentrations with their background values. It was observed that all the elements have higher concentrations in the soils than their background values, indicating that the soils are highly polluted. Table 8 also presents the I-geo values for the elements detected in the soils, the deductions from the results are summarized in Table 9. It is concluded that the soils are unpolluted with respect to Ti, moderately polluted with respect to Ca, heavily polluted with respect to K, heavily-very heavily polluted with respect to Sr and Mn and very heavily polluted with respect to Pb, Cr, Zn and Cu. Titanium does not bio-accumulate in the soil, that is why it is used as a standard in finding enrichment factor (EF).
| Element | This Study (Mean and Range) | Background value IUGS/IAGC (13) | Index of geo-accumulation (I-geo) |
|---|---|---|---|
| Ca | 172.00-979.19 (481.22 ± 314.74) | 60.0 | 2.42 |
| Fe | 907.00-1337.43 (1148.61 ± 454.37) | 700.0 | 0.13 |
| K | 1235.00-2431.23 (1013.35 ± 990.72) | 60.0 | 3.49 |
| Ti | 167.56-271.98 (204.16 ± 75.62) | 210.0 | -0.63 |
| Sr | 47.83-340.02 (221.03 ± 253.31) | 8.0 | 4.20 |
| Pb | 125.34-291.61 (191.18 ± 203.37) | 3.0 | 5.41 |
| Cr | 34.18-63.21 (48.76 ± 42.11) | 1.0 | 5.02 |
| Mn | 231.03-281.61 (254.24 ± 163.54) | 10.0 | 4.08 |
| Zn | 241.70-348.09 (299.41 ± 135.11) | 4.0 | 5.64 |
| Cu | 196.29-267.22 (239.44 ± 103.60) | 1.0 | 7.32 |
Table 8: Comparison of elemental concentrations of the soil samples with their background values (µg/g) and the I-geo of the elements
| Element | I-geo value | Remark | Element |
|---|---|---|---|
| Ti | -0.63 | Practically Unpolluted (PU) | Ti |
| Fe | 0.13 | Moderately Polluted (MP) | Fe |
| Ca | 2.42 | Moderately Polluted (MP)–Heavily Polluted | Ca |
| (HP) | |||
| K | 3.49 | Heavily Polluted (HP) | K |
| Sr | 4.20 | Heavily Polluted (HP)–Very Heavily Polluted | Sr |
| (VHP) | |||
| Mn | 4.08 | Mn | |
| Pb | 5.41 | Very Heavily Polluted (VHP) | Pb |
| Cr | 5.02 | Cr | |
| Zn | 5.64 | Zn | |
| Cu | 7.32 | Cu |
Table 9: Deduction from the Geo-accumulation values for the elemental composition of the soils
The result of the cross plot analysis of the soil against plant samples using analyzed elements as variables is presented in Figure 5. Cross plot analysis is used primarily in the earth sciences to describe a specialized chart that compares multiple measurements made at a single time and location along two or more axis. It was used in this study to establish inter-elemental relationships among the plant and soil components of ecosystem of the study area and also to assess the level of accumulation of metals from the oil-impacted soils by the plant samples. It is observed that strong positive correlation (R2=0.791) existed between the soils and plants. The strong positive correlation implied inter-element correlations between plants and soils, and that the relatively high concentrations of the analyzed elements in the plants were due to elemental uptake from the soils by the plants.

Figure 5: Cross plot of the dumpsite plant vs. soil samples using concentrations of the analyzed elements as variables
Figure 6 presents clustering analysis results for the analyzed elements in the dumpsite soils. On the X-axis of the dendrogram is the similarity matrix using Euclidean distance, while on the Y-axis are listed the analyzed elements. The results showed five groups viz: group 1 (Cr, Zr and As); group 2 (Pb, Sr, Cu, Mn, Ti and Zn); group 3 (Ca); group 4 (Fe) and group 5 (K). Group 2 also has three sub groups, i.e., (Pb and Sr); (Cu, Mn and Ti) and Zn. This indicated that the elements in the same group showed closest relationship, indicating chemical affinity and/or similar sources. For instance, group 2 members-Cu, Mn, Ti and Zn are transition metals having variable oxidation states among other similar properties which they possess and they may as well have the same source(s).

Figure 6: Cluster of the analyzed elements in the soil samples
Conclusion and Recommendation
From this study, the dumpsite soils have concentrations of the analyzed elements viz; Ca, K, Pb, Mn, Cr, Fe, As, Sr, Zn, Zr, Ti and Cu than the control soils. The elemental concentrations of the dumpsite and control plants (Talinum triangulae) followed the same trend. Comparison of the elemental concentrations of the dumpsite soil and plant samples with their control samples indicated that the ecosystem components have relatively high values of the analyzed elements. It is also observed that the plant has high uptake ability for Cr and least for Sr. Comparison of the elemental concentrations of the dumpsite soils and plants indicated that the soils were more loaded with the analyzed elements than the plants; this was confirmed by their t-test values. Cross plot analysis also confirmed inter-elemental relationship between the dumpsite plants and the soils, indicating that the plants were contaminated by the elements via the soils, while cluster analysis showed five groups which were also fairly clustered. From the overall results, it is concluded that the dumpsites were polluted with respect to most of the analyzed metals based on their concentrations.
This research work has revealed that plants grown on dumpsites soils can accumulate potential toxic elements than plants grown on the normal soils; therefore efforts should be intensified to discourage the practice of farm cropping at or near dumpsites. Dumping of waste on an open space and citing of dumpsites at backyards should also be greatly discouraged because residents who live close to such area are vulnerable to toxicity as a result of inhalation of these elements and/or their compounds if dumpsite is set ablaze.
Nomadic farmers should also be enlightened so that they do not rear their animals at dumpsites.
REFERENCES
- Ebong GA, Akpan MM, Mkpenie VN, et al. Heavy metal contents of municipal and rural dumpsite soils and rate of accumulation by Carica papaya and Talinum triangulare in Uyo, Nigeria. J Chem. 2008;5(2):281-90.
- Agyarko K, Darteh E, Berlinger B. Metal levels in some refuse dump soils and plants in Ghana. Plant Soil Environ. 2010;56(5):244-51.
- Tumuklu A, Yalcin MG, Sonmez M. Detection of heavy metal concentrations in soil caused by Nigde city garbage dump. Polish J Environ Stud. 2006;16(4)654-8.
- Nordberg GF. Biomarkers of exposure, effects and susceptibility in humans and their application in studies of interactions among metals in China. Toxicol Lett. 2010;192:45-9.
- Adriano DC. Trace elements in terrestrial environments: Biogeochemistry, bioavailability and risks of metals. Springer, New York. 2001;123-31.
- Anikwe MAN, Nwobodo KCA. Long term effect of municipal waste. 2002.
- Sauve S, Henderson W, Allen HE. Solid-solution portioning of metals in contaminated soils: Dependence on pH, total metal burden and organic matter. Environ Sci Technol. 2000;34:1125-31.
- Adebiyi FM, Asubiojo OI, Ajayi TR. Multisolvent determination of pH of soils from bituminous sands deposit areas of Nigeria. J Appl Sci. 2006;6(1):190-2.
- http://toxnet.nlm.nih.gov/cgi-bin/sis/htmlgen?HSDB
- Fasasi MK, Obiajunwa EI. Determination of soil to plant transfer rations of major, minor and trace elements in some vegetables grown around Ile-Ife, Nigeria. Nig J Pure Appl Sci. 2000;15:1019-23.
- Sahu AK. Present scenario of municipal solid waste (MSW) dumping grounds in India. Proceedings of the International conference on sustainable solid waste management, Chennai, India. 2007;327-33.
- Diatta JB, Chudzinska E, Wirth S. Assessment of heavy metal contamination of soils impacted by a zinc smelter activity. J Element. 2008;13(1)5-16.
- http: //www.iugc.org/PDF/AR07_IG_GGB.pdf
- Scott ML. Micronutrients in agriculture. Soil Science Soc Am. 1972;265-88.
- http://www.atsdr.cdc.gov/tfacts7.html