A study on improving the consistency of the results of Ca125 in different immune detection systems by serum assignment
2 Department of Orthopedics, Guigang Traditional Chinese and Western Medicine, China
Received: 16-Nov-2017 Accepted Date: Dec 26, 2017; Published: 30-Dec-2017
Citation: Liu G, Xie M, Su G, et al. A study on improving the consistency of the results of Ca125 in different immune detection systems by serum assignment. J Neurol Clin Neurosci. 2017;2(1):8-12.
This open-access article is distributed under the terms of the Creative Commons Attribution Non-Commercial License (CC BY-NC) (http://creativecommons.org/licenses/by-nc/4.0/), which permits reuse, distribution and reproduction of the article, provided that the original work is properly cited and the reuse is restricted to noncommercial purposes. For commercial reuse, contact reprints@pulsus.com
Abstract
Object: The study aims to understand the Ca125 in different immune detection system of mutual recognition of the results. And it is hoped to investigate the feasibility of improving the consistency of Ca125 results in different immune detection systems by serum calibration to provide experimental basis for the mutual recognition of the results of Ca125.
Methods: The Roche electrochemiluminescence assay of Ca125 mixed serum samples assignment was used as calibrator chemiluminescence immunoassay analyzer Kemei chemical plate. It is composed to be the self-immune detection system with Kemei reagent and instrument. The consistency between the two detection systems before and after the assignment and the Roche electrochemiluminescence immunoassay system was compared with the reference EP9-A2.
Results: After the self-calibration assignment detection system and detection system of the reference correlation coefficient of r2=0.968, suggesting the good correlation between the two systems. The regression equation of Y2-X group was Y=1.029X-2.007, and relative bias E alpha =2.86% (allowable deviation EA<25%), which showed the system is consistent with the results of the reference detection system. display after the assignment detection system with results consistent with the reference detection system.
Conclusion: The difference between the results of Ca125 detection on the original detection system and the results of the reference detection system can be improved by the calibration of the serum value, as well as the consistency of Ca125 results in different immune detection systems.
Keywords
Serum immune system assignment; Detection syste; Comparison; Ca125; Results of recognition
Introduction
Tumor markers detection is an integral part of the item in the clinical diagnosis and treatment. Ca125 is one of the conventional test items for the diagnosis and treatment of ovarian cancer and other diseases [1], which is widely carried out in domestic hospitals. In recent years, with the continuous optimization of antibody, improvement of markers and innovation of signal detection methods and apparatus, Ca125 all can be detected in all kinds of automatic immunoassay systems. Therefore, there are numerous detection methods and instruments, which will cause the differences due to the different detection systems will be affected by many factors [2]. It has become an urgent problem of how to realize the consistency of the results in different immune detection systems. The laboratory currently has 2 immune analyzer for Ca125 detection. One of them is a set of Roche Cobas E602 automatic electrochemiluminescence immunoassay, and the other one belongs to the Kemei CC1500 type automatic plate chemiluminescence immunoassay. In order to improve the consistency of the test results, This study used Roche electrochemiluminescence assay of Ca125 mixed serum samples assignment as calibrator chemiluminescence immunoassay analyzer Kemei chemical plate to analyze the consistency of test results of Kemei plate chemiluminescence immunoassay system and Roche electrochemical luminescence detection system before and after calibration. So as to investigate the feasibility of improving the consistency of Ca125 results in different immune detection systems by serum calibration for the purpose to provide the experimental basis for the mutual recognition of the results of Ca125.
Materials and Methods
Materials
Instruments and reagents
The reference detection system (X) is Roche Cobas E602 automatic electrochemiluminescence immunoassay analyzer, and the matching calibration products and reagents is also from Roche Cobas E602. The quality control materials are Landau immune quality control products.
The detection system before assignment (Y1) is CC1500 Kemei calibrator, chemiluminescence immunoassay analyzer, and the matching calibration products and reagents is also from CC1500 Kemei. The quality control materials are Landau immune control products. The detection system after the assignment (Y2) is Kemei CC1500 type chemiluminescence immunoassay analyzer, and the matching calibration products is also from CC1500 Kemei, while the calibration products are mixed with serum by Cobas E602 electrochemiluminescence analyzer. The control materials are from Landau QC immune control products.
Samples
The fresh samples in this study were selected from the outpatient and inpatient patients. Serum should be no hemolysis, jaundice and blood lipid, etc. The sample concentration covers the low, medium and high values. And the distribution range is in line with the documentation requirement from National Committee for clinical laboratory standards (National Committee for clinical laboratory, NCCLS) EP9-A2 [3].
Assignment of mixed serum
The fresh serum was collected in the reference detection system (X) from the outpatient and inpatient patients within 2 days. The serum has no hemolysis, blood lipid and jaundice, etc. The concentrations were close to 0.0 U/ml, 15.0 U/ml, 50.0 U/ml, 100.0 U/ml, 200.0 U/ml and 400.0 U/ ml. At least 5 portions of those concentrations were mixed and allocated. The reference detection system (X) is first used to detect repeatedly, until the result got the closest to the concentration of above mixed serum of six. And then the reference detection system (X) were put into used to measure the average of 5 times. The average value was looked as the calibration value. The assign mixed serum was packed and put in the temperature of -70 deg.c for preservation.
Methods
The Preliminary Performance Evaluation in the Detection System after assignment (Y2)
Before the experiment, EP10-A2 was used to evaluate the performance of the system. The evaluation indexes included linear range, deviation, total imprecision, intercept and slope, nonlinearity, carryover rate and drift [4].
Process of sample detection
According to the evaluation results of the linear range of the post assignment detection system (Y2), the results of the reference system X were selected as the fresh serum in the linear range of the Y2 detection system. And on the basis of the EP9-A2 file [3], 8 samples were selected every day. Those double samples were detected repeatedly with the reference detection system (X), detection system before assignment (Y1), and detection system after assignment (Y2) respectively. The determination orders were 1 to 8 and 8 to 1. The above process should be repeated 5 days (can be discontinuous). There are 40 samples in all and each batch was completed under the control of quality control.
Methodological comparison
The reference detection system (X) was taken as the comparison method, and detection systems before and after assignment (Y1 and Y2) was regarded as the testing method, which respectively composed Y1-X group (Y1-X group) and Y2-X group (Y2-X group). The correlation between the 2 methods was compared with the reference of EP9-A2 and related literature [5,6]. The relative deviation of expected value, expected deviation (BC) and relative medical decision level at Ca125 (EA) at a given medical decision level (Xc) was calculated. The consistency of methods was compared by the above parameters.
Statistics processing
According to the requirements of the EP9-A2 documents [3], Y1-X group and Y2-X group were examined by within and outlier detection. The absolute value of the difference between the mean value and the mean value should be less than 4 times the absolute value. If there is an outlier in the test result, it can be deleted. If there are more than two reasons to supplement the experimental data, then the EXCLE software was used to carry on the correlation regression analysis.
Results
Preliminary performance evaluation of post assignment detection system (Y2)
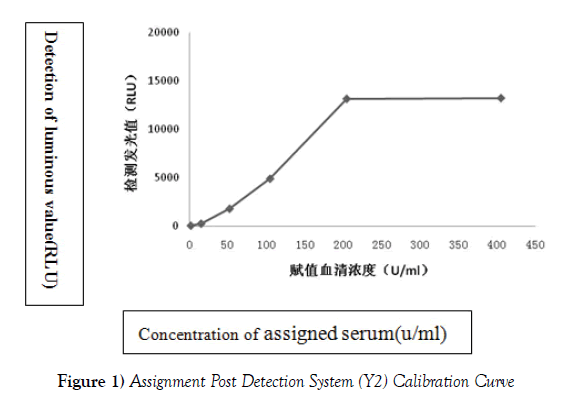
The assigned serum was used as temporary calibrator in Y2 system, and Ca125 kit Kemei plate chemiluminescence was put into use in Kemei CC1500 immunoassay analyzer for detection. The relative light unit (relative light unit, RLU) detected by the assigned serum was taken as the Y axis, while the concentration of serum was X axis, and the fitting curve was shown in Figure 1. From Figure 1, we can see when the standard is in the range of 0.0 U/ml to 200 U/ml, the Y2 detection system has a good linear relationship, which can preliminarily demonstrate that the Ca125 concentration range in the Y2 detection system is from 0 to 200 U/ml.
According to documents of SEP10-A2 and relevant literature [4], the performance of Y2 system for serum Ca125 was evaluated. The detection range of samples was selected from 0.0 to 200 U/ml, and the evaluation indexes include deviation, total imprecision, intercept and slope, nonlinearity, carryover rate and drift in Table 1.
| Indexes | Low, medium and high concentration samples (0.0~200.0 U/ml) | ||
|---|---|---|---|
| Low value | mid-value | High value | |
| Set value* (U/ml) | 26.9 | 101.3 | 190.7 |
| Actual deviation (%) | 20.7 | 7.5 | 13.1 |
| Allowable deviation (%) | 25 | 25 | 25 |
| Total non-fine density (%) | 8.1 | 7.8 | 5.0 |
| Allowable non precision density (%) | 10 | 10 | 10 |
| Intercept mean value | 1.286 | ||
| Slope mean value | 0.930 | ||
| Dyeing mean value | 0.073 | ||
| Nonlinearity mean value | 0.9×10⁻³ | ||
| Drift mean value | 0.206 | ||
Table 1: Analysis of deviation, total imprecision, intercept and slope, nonlinearity, dyeing rate and drift of Ca2-5 (0.0~200.0 U/ml) in Y2 system
The actual deviation and precision of Ca125 (0~200 U/ml) in Y2 system are not less than the allowable deviation and allowable imprecision in the laboratory. Within the requirements in the laboratory, the detection of preliminary performance evaluation of Ca125 (0~200 U/ml) in Y2 system is up to standard (Figure 1).
Statistics processing after assignment
Outlier processing
The detection data of Y1-X group and Y2-X group were examined with the within and between methods for outlier detection. After examination, there is no outliers within methods in the second methodology group, while there are three outliers in the between method. The three outliers appear in X-Y1 group of one, and X-Y2 group of two, which can be shown in Table 2. There is one sample in the two methodology methods group exceeded the control limit of the outliers, while the other sample is only out of control limit of outlier in the Y2-X group. For a more realistic evaluation of Y1 and Y2 systems, the outlier detection values in the 2 groups were eliminated, and the outliers in the Y2-X group were preserved (Table 2).
| Sample number | Average result in X system (U/ml) | Y1-X group | Y2-X group | ||||
|---|---|---|---|---|---|---|---|
| Average result (U/ml) | Absolute difference Ex-y1 | Outlier control | Average result (U/ml) | Absolute difference Ex-y2 | Outlier control limit | ||
| 0101 | 63.06 | 98.08 | 35.02 | 27.96 | |||
| 0302 | 155.2 | 42.28 | 112.92 | 60.4 | 66.71 | 88.49 | 27.96 |
Table 2: Significant outlier results and control limits
Statistical calculation
Calculate the difference between the mean value of Y1 detection system and the mean value of the reference system X. And the mean value of the mean difference between the methods in the Y1-X group was statistically analyzed. The linear regression equation and correlation coefficient of Y1-X group were calculated by EXCEL. The mean difference of the Y2-X group and the linear regression equation and correlation coefficient are calculated by the same method, which can be shown in Table 3.
| Groups of methods | Mean-Absolute Deviation Between methods(Ey) | Correlation coefficient (r2) | Standard error (s) | Slope (b) | Linear regression equation (Y=a+bX) | |
|---|---|---|---|---|---|---|
| Y1-X(n=39) | 15.10 | 0.975 | 4.86 | 0.777 | Y=0.777X-5.223 | |
| Y2-X(n=39) | 6.99 | 0.968 | 6.06 | 1.029 | Y=1.029X-2.007 | |
Table 3: Correlation coefficient and linear regression equation
Correlation comparison
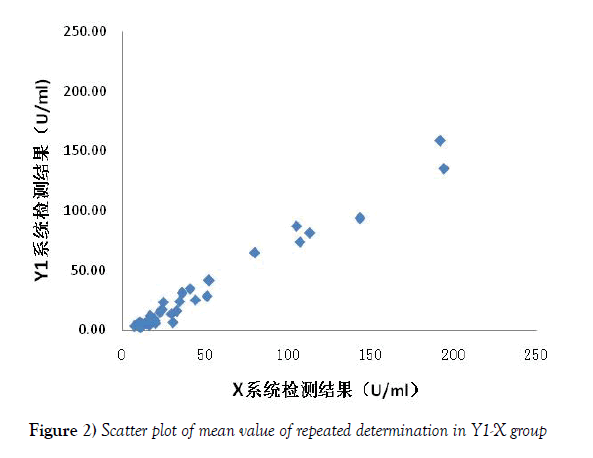
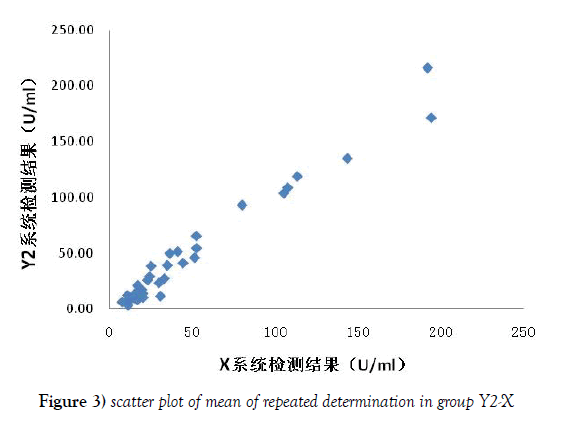
For Y1-X group scatter diagram, the X reference system (repeat determination mean) was regarded as the X axis, and the Y1 system being evaluated (repeat determination mean) was looked as the Y axis (Figure 2). The Y2-X group scatter diagram was made as the same way shown in Figure 3. The linear regression equation and correlation coefficient were calculated by EXCEL shown in Figure 3, and the correlation between the detection range of two system was compared. There was a good correlation between the 2 groups, and there was no significant difference between the 2 groups, but the slope of the Y2-X group was closer to 1 than that of the Y1-X group, which indicated that the results of the detection system Y2 after the assignment were closer to those of the reference system X.
Deviation chart
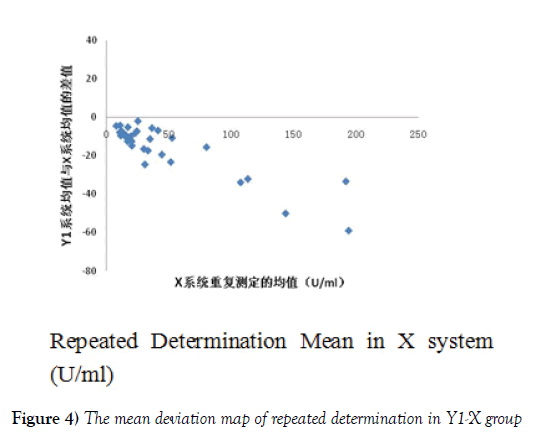
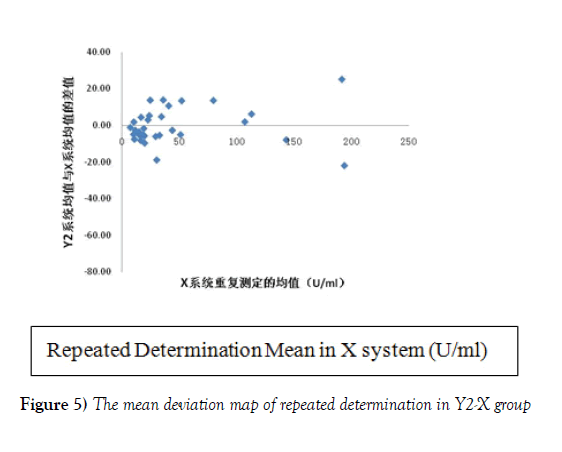
Reference system X (repeated determination mean)is for the X axis, and the mean of repeated determination in Y1 system together with repeated determination mean in X reference system was regarded as the deviation map of Y1-X group (Figure 4). The same method was used to make the deviation map of repeated determination mean of Y2-X group shown in Figure 5. As can be seen from Figure 4 and 5, Y1 system detection results and the reference system X detection results are negative deviation. Furthermore, with the increase of the concentration, the deviation increases, while the results of X Y2 system and the reference system appear small deviation. The distribution trend is close to the normal distribution. Moreover, in Figure 3, the mean absolute difference between groups in Y2-X group was less than that in group Y1-X, which can show that the difference between the results of Y2-X group was less than that of group Y1-X. Although with the increase of the concentration in Y2-X group, the deviation increased, but for the deviation in Y1 system, within the concentration range from 0 to 200 U/ ml of Y2 system, the deviation range of reference system of X decreases a lot.
Consistency comparison
The medical decision level concentration of Xc in Ca2-5 [7] was taken into the regression equation of Y1-X group, and calculate the expected value. So it is to calculate the expected bias and relative bias of Y1-X group according to the expected bias calculation formula of Bc=Yc - Xc and relative bias formula Eα= | Bc/Xc|×100% in EP9-A2. The expected value, expected bias and relative bias of the Y2-X group were calculated by the same method. The relative bias (EA < 25%) allowed by the Ministry of health center for testing Ca125 was referred as the acceptable range [8]. The results are shown in Table 4. The relative bias of Ea in Y2-X group was significantly lower than that in group Y1-X, and it was far less than that allowable bias EA allowed by the Department of health. The detection results in Y2 detection system after assignment is acceptable, which is consistent with the results of the reference detection system X. However, the relative bias Ea in Y1 detection system and the reference detection system X is greater than the allowable bias EA. Therefore, the expected bias of Y1 detection system Bc is not acceptable, and the Y1 detection system is not consistent with the reference system X (Table 4).
| Method groups | Medical decisive standard Xc (U/ml) | Expected bias Bc (U/ml) | Relative bias Eα (%) | Allowed bias of ministry of health clinical examination center EA (%) |
|---|---|---|---|---|
| Y1-X | 35.0 | -13.06 | 37.31 | 25 |
| Y2-X | 35.0 | -1.00 | 2.86 | 25 |
Table 4: The bias assessment in the two method group
Discussion
Tumor marker is a kind of substance floorboard which can reflect the occurrence and development of tumor, and surveillance to the efficacy of tumor. Those tumor makers are protein, polypeptide antigen, polyamine substances and cell reactive antibody in general. The vast majority of tumor markers are detected with the qualitative and quantitative methods based on the principle of antigen antibody reaction. And the carbohydrate antigen 125 (cancer antigen 125, CA125) is a common tumor marker which is a high molecular weight mucin like glycoprotein, also known as ovarian cancer associated antigen, used for the diagnosis and treatment for ovarian cancer and other related diseases.
At present, the methods commonly used in CA125 detection include enzyme labeling, radioactive labeling and chemiluminescent labeling. Because the chemiluminescence detection on CA125 has high sensitivity and stability, it becomes the most widely used in clinical [2]. All of these methods are based on the principle of antigen antibody reaction. Although the antigen antibody can produce specific reaction like enzyme and substrate, the reaction of antigen antibody shows great difference from that of enzymatic reaction. The specific reaction of antigen antibody is a reversible reaction, which is greatly influenced by antigen antibody affinity, reaction temperature, pH and ion concentration. Furthermore, the international organization for Standardization (International Organization for Standardization, ISO) also has failed to develop primary reference to Ca125 or reference methods so far. That’s why the detection system can not achieve standardization traceability to the same result. Moreover, it also limits the unified testing results of experiment system. It has been reported in the literature that CA125 has no consistency between different detection systems [2].
In this paper, the reference detection system (X) used the Roche Cobas E602 automatic electrochemiluminescence analyzer, which is based on the method of electrochemiluminescence immunoassay (electrochemiluminescence immunoassay, ECLIA). And Kemei CC1500 type chemiluminescence immunoassay analyzer in test system was based upon enzymatic chemiluminescence method (chemiluminescent enzyme immunoassay, CLEIA). Both of the two methods are one of the methods of chemiluminescence labeling. The results in the two kinds of detection system are shown Kemei matching detection system (detection system Y1 before assignment) and Roche electrochemiluminescence detection system (reference detection system X) is not consistent. That’s because the different factors in the two systems, such as different reagent coated antibody titer and the reaction space configuration or the environment, which causes the differences in the ability to combine with Ca125. The other reason is that the standard of the two systems cannot be traced to the same reference. Although the same unit was used, the concentration of Ca125 is not consistent, which led to the difference between the measured values of the two systems.
Roche electrochemiluminescence detection system is a kind of closed detection system which has significant high precision and accuracy, while Kemei chemiluminescence detection system is an open system. In this study, the mixed serum was used to evaluate the Roche electrochemiluminescence detection system and then it replaced the reference standards of Kemei. Meanwhile, using Kemei reagent and instrument composed of self built system to explore the use of the serum Ca125 in different transfer assignment to solve the feasibility of results consistency in immune detection system. The results show that the results of the preliminary evaluation of the performance of the detection system after assignment (Y2) is good according to the EP10-A2 file. In a certain concentration range of 0.0 to 200.0 U/ml, if it has good precision (the total imprecision of CV ≤ 8.1) and a good linear relationship, the self-system can be built successfully. Nevertheless, if light value (RLU) is larger than that of the 200.0 U/ml concentration range, the detection value is nonlinear. Analyzing its reason, the detection method for the solid-liquid phase reaction environment should be considered, because the reaction rate is low, and the high concentration of the sample is not sufficient reaction. The solution can be considered dilution or prolonging the reaction time. However, it is not within the scope of this article, it can be studied further. Then, the correlation and consistency between the two detection systems before and after the assignment according to EP9-A2 and the Roche electrochemiluminescence detection system (X) were evaluated in the range of 0 to 200 U/ml. There are 3 inter method outliers. Among which, there is one sample both showing inter method outlier before and after the assignment of the two detection systems. It is reported that high concentrations of sugar chains in tumor patients may produce cross reactivity. There is specific recognition ability of antigen binding sites in different reagents, and there is a competitive antibody binding to CA125 in the patient. However, the ability of different detection systems to exclude the interference is also large, which leads to the difference of the measured values [2]. Therefore, it is impossible to exclude the possibility of the presence of other interfering substances in the sample. The solutions to solve it need to be studied, but not within the scope of this article. After excluding outliers, Xc regression analysis was performed with EXCLE software, and the expected value, expected deviation (BC) and relative medical decision level (EA)of Ca125 given by medical decision level were calculated. The results show that the correlation coefficient of r2 in the detection system after the assignment (Y2) and reference detection system (X) is equal to 0.968, showing the correlation is good. The regression equation in Y2-X group Y was equal to 1.029X-2.007, and the relative bias of E alpha was equal to 2.86% (allowable deviation EA<25%), which both showed that the results of the detection system after assignment were consistent with those in the reference detection system, which achieves the purpose of this study.
Limitations of this study
The study on methodology of immunoassay technology of antigen antibody reaction was affected by packet antibody fragments, matrix effects, and the system based on the detection performance. Although this study used the reference system of mixed serum assignment Ca125 calibration of another system, which made the two detection system consistency improve, the results of this study only can only be used for open detection system, while the closed detection system needs further study. In addition, the study still can not completely solve the differences on the detection ability of Ca125 problems of different immune detection reagent of using different coated antibody fragment. Therefore, it needs to expand the sample size for further observation on different influencing factors. Moreover, it is also necessary to do further research on the problem of whether the high concentration sample beyond the linear range can be used to solve the problems such as the high concentration sample detection and the detection limit of the post detection system.
What’s more, in this study, all the patients were treated in our hospital, so the results can only reflect the situation in the region, not the situation of the country. In order to represent the national condition, a lot of manpower is needed to invest. Meanwhile, because of the longer time of case selection, the detection time of the observation index is longer, and the quality control has certain limitations.
Conclusion
The mixing serum after assignment, instead of the original detection system calibrator, composed to be self built system with original reagent and instrument, which can improve the differences of the original Ca125 in the detection results from the original detection system and the reference detection system. Moreover, it can also heighten the consistency of Ca125 results in different immune detection systems, to provide the experimental basis for the feasibility of the mutual recognition of Ca125.
Declaration
The authors declare that they don’t have competing interests.
Contributions
Gangyi Liu is responsible for the total project organization coordinated implementation. Meizhen Xie and Guosheng Su participated in the research. They were responsible for case collection and data statistics. Lihua Qin and Ting Rong were responsible for clinical detection and data processing.
Acknowledgement
During the process of this topic research, we got much help from many departments and individuals, such as the city health bureau leadership and technology bureau leadership, and our hospital of Infectious Diseases and Infection Clinic, and other personnel not involved in this project research. All of them offered a great support and help in this research. Now here, all of members of this research group show our deepest appreciation to them, and wish them good health and everything goes well.
Fund Project
The Guangxi Zhuang Autonomous Region Health Planning Committee self funding research project (NO.: Z2015127).
REFERENCES
- XiaoRui L, Weiping Li, Wenshen Di. Progress of ovarian cancer research of Serum tumor markers for early diagnosis. Inter J Obstetrics and Gynecology. 2009;36(6):458-61.
- Qiaoti Z, Erfu X, Zhang. Consistency evaluation of three CA125 detection systems. J Clinical Pathology. 2015;35(1):65-9.
- National Committee for Clinical Laboratory Standards. Medthod comparison and bias estimation using patients samples; approved guideline EP09-A2 [S]. Ann Arbor: Thomson Reuters. 2002.
- Honghua S, Lingbo S, Hong Kang. NCCL SEP10-A2 files were used to evaluate the performance of self-built and biochemical testing system. Laboratory Medicine. 2010;25(5): 345-8.
- Jie C, Lanlan W, Lixin W. Evaluation of the consistency of the 2 methods based on NCCLS-EP9-A2 for the analysis of Luminescent Immunoassay. J Clinical Laboratory. 2006;24(3):169-71.
- Honghua S, Lingbo S, HongKang. A study on the value of fresh serum transfer to improve the results of self-built and biochemical testing system two. Inter J Laboratory Med. 2011;32(2):156-8.
- Wuying Y, Liusan W, Ziyu S. National clinical laboratory operating procedures. Beijing: People's Medical Publishing House. 2015:539-40.
- Lier W, Chengju O. Comparative study on the results of the self determination of immune detection system. Inter J Laboratory Med. 2011;32(9):957-60.


