
Assessment of Radon Gas Concentration at Ayoon Al-Hammam, Alkora-Jordan Water Purification Plant
2 Department of Physics, Yarmouk University, Jordan
Received: 07-Sep-2022, Manuscript No. puljeg-22-5327; Editor assigned: 10-Sep-2022, Pre QC No. puljeg-22-5327(PQ); Accepted Date: Sep 27, 2022; Reviewed: 19-Sep-2022 QC No. puljeg-22-5327(Q); Revised: 24-Sep-2022, Manuscript No. puljeg-22-5327 (R); Published: 23-Oct-2022
Citation: Khraisat IAS, Al-Bataina B, Gharaibeh S. Assessment of radon gas concentration at ayoon al-Hammam, alkora-jordan water purification plant. J Environ Geol. 2022;6(4):21-27.
This open-access article is distributed under the terms of the Creative Commons Attribution Non-Commercial License (CC BY-NC) (http://creativecommons.org/licenses/by-nc/4.0/), which permits reuse, distribution and reproduction of the article, provided that the original work is properly cited and the reuse is restricted to noncommercial purposes. For commercial reuse, contact reprints@pulsus.com
Abstract
The 222Rn measurements were conducted using passive diffusion radon dosimeter containing CR-39 detectors from the extraction wells until it reached the consumer. The results showed that the average radon gas concentrations from all wells was (3.2 Bq/l ±0.3 Bq/l), while the average radon gas concentrations for the three pump stations was (3.1 Bq/l ±0.1 Bq/l), and the average for tap water was (2.0 l Bq/l ±0.1 Bq/l). All the obtained results were below the maximum allowed concentration level prescribed by US- Environmental Protection Agency (11.1Bq/l). The total annual effective dose for all water samples varies from (0.01mSV/y) to (0.08 mSv/y), which is less than the maximum contaminant level (0.1 mSv/y). Hence, the groundwater in the study area does not pose health risks to consumers because the health risk factor for having lung cancer was estimated to be (0.005 %) However, the 222Rn concentrations can be significantly improved, if the plant includes an aeration unit.
Keywords
Drinking water; Groundwater; Radon gas; CR-39
Introduction
Radon (222Rn) is a colorless, odorless, and tasteless radioactive noble gas that originates from the decay of the uranium series (238U) [1]. Radioactive decay occurs because certain nuclei are unstable in their current state and seek to lose some of their excess energy by expelling a nuclear particle or electromagnetic radiation out of the nucleus to reach a lower energy state. The rate of disintegration of any radionuclide is described in terms of the activity, which is the number of nuclei decay per unit time [2]. Radon has a half-life of 3.82 days and decays within hours to form short-lived solid radioactive progeny with the release of alpha and beta emissions [3]. Radon emits its alpha particle with decay energy of 5.49 MeV and forms the element polonium (218Po) [4]. Radon is highly soluble in water and found as natural pollutant in Groundwater (GW), soils, and surface waters [5, 6]. The quantity of dissolved radon found in GW range from (10−4 Bq/l to 102,000 Bq/l) depends on [7,8]:
1. Lithology
2. The characteristics of the aquifer such as porosity and permeability.
3. Various amounts of natural uranium present in certain types of rocks and radium content [9].
4. The distance from the source.
5. The residence time of water within the aquifer.
Hence, radon activity in GW varies spatially from one place to another. In general, radon activity in GW is primarily controlled by the distribution of uranium and radium present in the parent rocks [10].
Radon can enter indoors from the soil through foundation cracks or via consumption of GW and can cause damage to human health [4]. Also, it is affected by meteorological factors such as temperature and pressure variations [11].
Radon and its decay solid products contribute significantly to human exposure to natural radiation sources. The World Health Organization (WHO) identified chronic exposure of residential areas to radon and its decay products as a second cause of lung cancer after tobacco use and the first in non-smokers [12]. Radon, with a density of 9.72 g/l is 7.5 times heavier than air; this causes it to accumulate on the ground floor [13]. Humans are exposed to radon through ingestion and inhalation. Dissolved radon in water is released into indoors when water is used for bathing, washing,and other domestic uses [14]. When radon gas is inhaled into a person’s lungs, alpha particles are emitted as an energy that can damage the DNA in sensitive lung tissue and cause lung cancer [15]. The WHO listed lung cancer as the main cause of death worldwide, it is estimated that there are 8.2 million deaths annually at present and it is estimated that by 2030 it will be 10 million deaths [16]. In Jordan, lung cancer is the most common cause of death among other types of cancer [17]. When radon gas is ingested, the dissolved radon in drinking water releases radiation in the stomach and other organs which can expose sensitive cells to damage causing stomach and gastrointestinal cancers [1]. Therefore, it is important to identify the amount of radon in GW in domestic environments to prevent increased radiation exposure and to quantify potential health risks.
This study describes the path of radon from Ayoon Al-Hammam water wells, located in Al-Korah district-Irbid governorate-Jordan, to the drinking water purification plant, and finally to the consumers at their homes in Tubneh, Dair Abu Said, and Sammou towns. The geology of the studied area and the human health risks to the final consumers were also considered.
Materials and Methods
The study area, Ayoon Al-Hammam wells (AAWs), is located at the Northern part of Jordan to the west of Irbid governorate and near Deir Abu Saied town at Ayoon Al-Hammam valley, between the coordinates 32.507778°N and 35.702500°E (Figure 1). It contains five wells that supply about 14,000 m3 per day to Ayoon Al-Hammam Water Purification Plant (AWPP). The AWPP is a small simple disinfection plant used to disinfect GW as a conservation step and to maintain the purity of the drinking water along the supply pipeline. The pumped water from the five wells is collected in a 1000 m3 reservoir without mechanical aeration. Finally, the water is chlorinated and distributed via three pumping stations to the inhabitants in Deir Abu Said, Sammou, and Tubneh as drinking water.

Figure 1: Location map for the study area
The study area contains three litho-stratigraphic groups outcropping in the northern part of Jordan (Figure 2), which are the Ajloun Group, Balqa group, and Jordan Valley group. In the study area, the oldest exposed formation is Wadi As Sir Limestone Formation (A7), it overlies the Shu’ayb (A5-6) Formation of the Ajloun Group, and is overlain by Wadi Umm Ghudran (B1), Amman Silicified Limestone (B2a), Al-Hasa Phosphorite (B2b), Muwaqqar Chalk Marl (B3) Formations of Belqa Group [18].

Figure 2: Geological map of the study area [19]
The hydrogeology of the aquifer system in the study area (Figure 3) belongs to the Middle Aquifer System or Upper Cretaceous (B2/A7)Amman-Wadi Sir Hydraulic Complex. This system consists of two carbonate formations, Amman Silicified Limestone Formation (B2a) and Wadi Al Sir Formation (A7). The main aquifer in AAWs region is (B2/A7) that overlain by the Muwaqqar chalk Marl Formation, which a confined aquifer is. The average thickness of the study area is about 200 m; it increases towards NE to reach about 300 m-350 m and decreases NW to reach about 180 m-200 m. Generally, the average yield of wells in the B2/A7 aquifer system is around 123 m3/h, and the storage coefficient in the confined conditions varies from 10-3 to 10-5 with a specific yield of more than 30%. The average transmissivity of B2/A7 is about 467 m2 /d, for the study area the transmissivity of B2/A7, is 324 m2 /d-544 m2 /d; and yields about 85 (m3 /hr). The hydraulic conductivity of B2/A7 is 8.1 m/s×10-5 m/s and porosity is 45% [18].

Figure 3: Wells depth and thickness of Amman-Wadi Al Sir aquifer [18].
Fifty-four water samples were collected during June 2020 for radon detection: three replicated water samples were collected directly from the five wells (15 samples), three replicated samples from the chlorinated water, and three replicated samples from the three pumping stations (12 samples). Finally, 27 samples were randomly collected from the homes of the three targeted towns. The concentrations of 222Rn were measured using CR-39 detectors (ally-diglycol carbonate, C12H18 O7 ), which is the most popular member of the SSNTD family that is used to measure alpha particles in ionizing radiation, and it is available on a commercial scale. It can detect all alpha energies from zero to more than 7.7 MeV without any degradation [20].
70 ml of water from each sample was poured into an empty plastic cup. Each sample cup was covered and glued tightly by an inverted passive diffusion radon dosimeter cup, this technique is known as the closed can technique or ‘dosimeters’’, as shown in Figure 4. Each dosimeter contains a piece of CR-39 detector of dimensions (1 cm × 1 cm) and 500 µm thicknesses; fixed at the bottom of a plastic cup; 7.0 cm in diameter and 4.6 cm in depth and using a double face scotch tape. A circular hole of radius 0.635 cm is made at the center of the lid and then sealed from inside with a piece of sponge with dimensions (2 cm × 2 cm × 0.5 cm). This configuration was necessary to prevent any dust particles and to inhibit thoron gas from entering the dosimeters, so only radon can get into the dosimeter [21].

Figure 4: Cross-section of the passive radon dosimeter with the water sample
According to Al-Bataina et al., 1997 [21], the distance from the surface of the water in the sample cup to the CR-39 detector is preferred to be (2.5 times-3 times) of water height because it gives the most precise result. Then it was closed tightly in a polyethylene bag and thermally insulated and left for 74 days for secular equilibrium; because radon needs at least from (4 times-7 times) of it is half lifetime to become at a secular equilibrium state with its daughter [21]. It was found theoretically that any time ( ≥ 7 t ½) for radon i.e (30 days) is sufficient to reach the beginning of a secular equilibrium between 226Ra and 222Rn, or 222Rn and 218Po. But if we wait for a longer time i.e. (15 t 1/2) (70 days) we will be sure that defiantly we have secular equilibrium, in addition to the fact that we will accumulate enough nuclear tracks (N), where the random statistical error is √Ni, and the relative statistical error will be √N/N ≈ 10%-15% of the actual value.
After 74 days of exposing CR-39 detectors to radon gas from groundwater, some alpha particles might hit the CR-39 detector and form nuclear tracks. The nuclear tracks formed on the CR-39 detectors can be seen neither by the human eye nor by an optical microscope; their sizes are very small (in nm); therefore, CR-39 detectors were chemically etched using 7 M KOH aqueous solution as an etchant for eight hours in a thermostatically controlled water bath at a constant temperature of 70 °C ± 0.1 °C. After the desired period of etching, the detectors were removed, washed under running water for 10 minutes to remove all the KOH solution that may still be present on the surfaces of the detectors, and were immersed gently in a small bath of distilled water for a few minutes to remove any etching pits. After drying, the detectors were ready to be counted using an optical microscope with a suitable magnification.
Data interpretation
The radiological effects of dissolved radon intake are described as the effective dose of radiation received from the population at the time of daily water intake. A relationship is used to assess an appropriate annual dose for a single person by the ingestion and inhalation of radon from drinking water by using these equations:
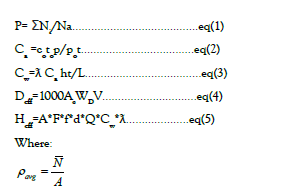
ρaverage : Measured average surface density of nuclear tracks on the exposed detectors (track/cm2 ). Ni: Number of tracks on the surface of the detectors for each view.(N:) Average number of nuclear tracks on the surface of CR-39. A: Area of the view measured using a Vernier caliber mounted along with the table of the microscope and found to be (A= 3.14 cm2 ×10-2 cm2 ).
Radon concentration in the air above water samples (Ca in Bq/m3 )

Co: Radon activity concentration of the calibration chamber (Co =90 kBq/m3 ). to: Calibration exposure time (48 hours or 2 days). ρ: Measured average surface density of nuclear tracks on the exposed detectors (track/ cm2 ). ρ_o: Average surface density of nuclear tracks on the calibrated detectors (3.3021*104 track/cm2 ). t=Exposure time of studied samples (74 days).
Radon concentration in the water samples (Cw in Bq/m3 )

ƛ: Decay constant of 222Rn.
Ca : Radon concentration above the water sample (Bq/m3 ).
h: Distance from the surface of water in the sample cup to the CR-39 detector (6.5 cm).
t: Exposure time of the sample (74 days).,
L: Height of water sample (2.5 cm).
Annual effective radiation dose from radon ingestion of drinking water (Deff in mSv/y)
Deff=1000Ac WDV (3.4)
Ac : Radon concentration in water (Bq/l).
WD: Dose conversion coefficient for adults equal to 1× 10⁻⁸ (mSv/Bq).
V: Volume of annual water consumption equal to 182.5 (L/Y) [22]
Annual effective dose for adults from radon inhaled during water usage (Heff in mSv/y)
Heff=A*F*f*d*Q*Cw*ƛ (3.5)
A: It is a conversion coefficient and is equal to 0.27 WL/Bq/l for representing the concentration of radon decay products present in one liter of air in terms of Working Level (WL) instead of (Bq/l). One Working Level (1WL) is defined as any combination of short-lived radon decay products in one liter of air that ultimately releases (1.3*105 MeV) of alpha energy during decay. Also;1 WL=3700 Bq/L =100 pCi of radon concentration in secular equilibrium with its daughter [22].
F: Equilibrium factor between radon and its daughters, equal to 0.3 [23].
f: Transfer factor of radon gas from water into air of the dwellings, equal to 1× 10⁻⁴ in the air per 1 Bq/L in water [24].
d: Dose conversion coefficient of radon progeny in the respiratory region, equal to 5 (mSv/WLM).
Q: Quality factor for alpha particles, equal to 20.
Cw: Radon concentration in water in (Bq/l).
ƛ: Equivalent occupational working months per year for a member of the population allowing for residency time and breathing rate, equal to 18 (M/y) [23].
Results and Discussion
Radon gas concentrations from wells to tap water
Radon gas concentrations at Ayoon Al-Hammam wells
Table 1 shows the Rn concentrations in groundwater collected from the five wells sampling locations. Overall, Rn levels ranged from 0.6 Bq/l to 4.9 Bq/l., with an average of 3.2 Bq/l, which doesn’t exceed the permissible level (11.1Bq/l) recommended by the US-Environmental Protection Agency [25].
TABLE 1. Average radon gas concentrations at Ayoon Al-Hammam wells
| Ayoon Al-Hammam wells | Sample 1 (Bq/l) | Sample 2 (Bq/l) | Sample 3 (Bq/l) | Average of wells samples (Bq/l) | Total average of the five wells (Bq/l) |
|---|---|---|---|---|---|
| AF001 | 4.5 ± 0.3 | 5.1 ± 0.8 | 5.0 ± 0.6 | 4.9 ± 0.3 | |
| AF002 | 1.5 ± 0.2 | 1.2 ± 0.3 | 1.4 ± 0.2 | 1.4 ± 0.2 | |
| AF003 | 5.0 ± 0.5 | 4.8 ± 0.6 | 4.0 ± 0.5 | 4.6 ± 0.5 | 3.2 ± 0.3 |
| AF004 | 4.3 ± 0.7 | 4.6 ± 0.9 | 4.4 ± 1.0 | 4.4 ± 0.2 | |
| AF005 | 0.53 ± 0.1 | 0.6 ± 0.2 | 0.7 ± 0.2 | 0.6 ± 0.1 |
The results show no significant differences in the replicates within each well, but there are significant differences between the five wells. The maximum radon concentration was in AF001 with a concentration of 4.9 Bq/l ±0.3 Bq/l, while the minimum concentration was in AF005 with a concentration of 0.6 Bq/l ±0.1Bq/l. The differences in radon gas concentrations between the wells which are located at the same type of aquifer (B2/A7) could be related to differences in depth between them.
As mentioned earlier, the behavior of radon in GW is very complex and is influenced by several factors. Hence, radon activity in GW varies spatially from one place to another. In general, radon activity in GW is primarily controlled by the distribution of uranium and radium present in the parent rocks [10].
Also, the quantity of dissolved radon in GW depends on many different factors as lithology, in this case study; the aquifer system is B2/A7 which is mainly composed of limestone. It is well known that limestone has low traces of uranium and radium. Therefore; we expect to have low radon concentration in the GW present in such an aquifer system and it depends on the characteristics of the aquifer, whether it is confined or unconfined; in this study the aquifer is unconfined, which allows radon to move out through pores (porosity is about 45%).
Radon gas concentrations of the chlorinated water at the reservoir
The average radon gas concentration of the chlorinated water at the reservoir, which is fed by the five wells and chlorinated directly at the reservoir, was 3.8 Bq/l ±0.3 Bq/l, while the average radon gas concentration at the five wells is 3.2 Bq/l ±0.3 Bq/l; upon comparing these two values; they look roughly comparable. This may be explained first by the absence of vital mechanical aeration at the purification plant and secondly by the fact that water chlorination is not efficient in removing radon from water.
Radon gas concentrations at the three pump stations
Table 2 shows the Rn concentrations at the three pump stations sampling locations. Overall, Rn levels ranged from 2.8 Bq/l to 3.4 Bq/l., with an average of 3.1 Bq/l, which also doesn’t exceed the permissible level (11.1Bq/l) recommended by the US-Environmental Protection Agency [25].
TABLE 2. Average radon gas concentrations at the three pump stations
| Location of the pump station | Sample1 Bq/l | Sample 2 (Bq/l) | Sample 3 (Bq/l) | Average of pumps samples (Bq/l) | Total average of the 3 pump stations (Bq/l) |
|---|---|---|---|---|---|
| Tubneh | 3.0 ± 0.1 | 2.7 ± 0.2 | 2.8 ± 0.2 | 2.8 ± 0.1 | |
| Dair Abu Saied | 3.4 ± 0.1 | 3.0 ± 0.2 | 3.0 ± 0.1 | 3.1 ± 0.2 | 3.1 ± 0.1 |
| Sammou | 3.3 ± 0.2 | 3.4 ± 0.1 | 3.4 ± 0.1 | 3.4 ± 0.1 |
The results above show the maximum radon concentration at Sammou pump station with an average concentration of 3.4 Bq/l ± 0.1 Bq/l and the minimum concentration at the Tubneh pump station with an average concentration of 2.8 Bq/l ± 0.1Bq/l. These small differences in radon gas concentrations between the pump stations may be explained by the transportation of the water to different distances and because of the loss in radon gas during pumping. However, pumping the drinking water through the pipeline did not contribute to any significant removal of radon.
Radon gas concentration at homes tap water
Table 3 shows the average radon gas concentration at homes of the three different towns. The results show that the maximum value was in Sammou homes (2.3 Bq/l ± 0.2 Bq/l) and the minimum was in Tubneh homes (1.7 Bq/l ± 0.3 Bq/l). These differences may be explained by different passive aeration in the water storage tanks by the population.
TABLE 3. Average radon gas concentration levels of home tap water
| Towns | Average of 3 replicate samples (Bq/l) | Average of 3 replicate samples (Bq/l) | Average of 3 replicate samples (Bq/l) | Average of 3 samples (Bq/l) | ||
|---|---|---|---|---|---|---|
| Tubneh | 2.0 ± 0.4 | 1.4 ± 0.3 | 1.7 ± 0.3 | 1.7 ± 0.3 | ||
| Dair Abu Saied | 2.5 ± 0.1 | 1.8 ± 0.1 | 2.0 ± 0.1 | 2.1 ± 0.3 | ||
| Sammou | 2.5 ± 0.4 | 2.4 ± 0.2 | 2.1 ± 0.1 | 2.3 ± 0.2 | ||
Figure 5 shows the average radon gas concentrations at the wells, reservoir, pumping stations, and home’s tap water. It is obvious that the radon concentrations are decreasing with the distance from the source to the consumer, but the removal of radon, in this case, is not efficient.

Figure 5: Average radon concentrations at the wells, reservoir, pumping stations, and homes tap water
Effective dose assessment
Annual effective dose from drinking water
Annual effective dose from ingestion and inhalation of radon from drinking water
Table 4 shows the annual effective dose from ingestion and inhalation of radon gas in drinking water for all samples.
TABLE 4. Annual effective dose from ingestion and inhalation radon of drinking
| Water source | Average radon gas Concentration (Bq/l) | Annual effective dose from radon ingestion of drinking water D eff (mSv/y) | Annual effective dose from radon inhaled during water usage Heff (mSv/y) |
|---|---|---|---|
| AF001 | 4.9 ± 0.3 | 0.0089 ± 0.0005 | 0.0714 ± 0.0044 |
| AF002 | 1.4 ± 0.2 | 0.0025 ± 0.0004 | 0.0204 ± 0.0029 |
| AF003 | 4.7 ± 0.5 | 0.0086 ± 0.0009 | 0.0685 ± 0.0073 |
| AF004 | 4.5 ± 0.2 | 0.0082 ± 0.0004 | 0.0656 ± 0.0029 |
| AF005 | 0.6 ± 0.1 | 0.0011 ± 0.0002 | 0.0078 ± 0.0015 |
| Reservoir | 3. 8 ± 0.3 | 0.0069 ± 0.0005 | 0.0554 ± 0.0044 |
| Tubneh pump station |
2.8 ± 0.2 | 0.0051 ± 0.0004 | 0.0408 ± 0.0029 |
| Dair Abu Saied pump station | 3.1 ± 0.2 | 0.0057 ± 0.0004 | 0.0452 ± 0.0029 |
| Sammou pump station |
3.3 ± 0.1 | 0.0060 ± 0.00002 | 0.0481 ± 0.0015 |
| Tubneh tap water |
1.7 ± 0.3 | 0.0031 ± 0.0005 | 0.0248 ± 0.0044 |
| Dair Abu Saied tap water | 2.1 ± 0.3 | 0.0038 ± 0.0005 | 0.0306 ± 0.0044 |
| Sammou tap water |
2.3 ± 0.2 | 0.0042 ± 0.0004 | 0.0335 ± 0.0029 |
The recommended Reference Dose Level (RDL) of the effective dose is 0.1 mSv/year resulting from the consumption of drinking water (the possible total radioactive contamination of the annual drinking-water consumption) [26]. The total annual effective dose of radon is depending on the average radon gas concentration at the samples, so the annual effective dose rises within the average concentration of radon.
The results indicate that more than 90% of the dose is attributable to radon in water coming from inhalation rather than ingestion. So it is more proper to measure radon concentration in the air rather than in drinking water. Therefore, controlling the inhalation pathway rather than ingestion is the most effective way to control radiation doses from radon that is exposed to reach the human body [26].
The effect of inhalation of radon gas is greater than ingesting it. The annual effective dose from ingestion and inhalation varied from (0.0011 mSv/y ± 0.0002mSv/y) and (0.0078 mSv/y ± 0.0015mSv/y) respectively to (0.0089 mSv/y ± 0.0005mSv/y) and (0.0714 mSv/y ± 0.0044mSv/y) respectively, where the minimum was at(AF005) Ayoon Al-Hammam 5 and the maximum at(AF001) Ayoon Al-Hammam1. For pump stations, the minimum value of ingestion and inhalation effective dose was at Tubneh pump station with an average of (0.0051 mSv/y ± 0.0004mSv/y) and (0.0408 mSv/y ± 0.0029mSv/y) respectively.
The minimum annual effective dose from ingestion and inhalation of radon at home tap water was at Tubneh; with an average of (0.0031 mSv/y ± 0.0005 mSv/y) and (0.0248 mSv/y ± 0.0044 mSv/y) respectively.
Figures 6 and 7 show the annual effective dose from ingestion radon of in drinking water and annual effective dose from inhalation of radon during water usage.

Figure 6: Annual effective dose from ingestion radon of drinking water (mSv/y)

Figure 7: Annual effective dose from inhalation radon during water usage (mSv/y)
Total annual effective dose from drinking water
Table 5 shows the total annual effective dose (H eff+D eff) due to both inhalation and ingestion for all water sample sources. The total annual effective dose of all water sample sources varies from (0.01 mSv/y) to (0.08 mSv/y), which is less than the maximum recommended limit
TABLE 5. The annual effective dose of all water sample source
| Source | Total annual effective dose (H eff+D eff) mSv/y |
|---|---|
| AF001 | 0.0803 |
| AF002 | 0.023 |
| AF003 | 0.0771 |
| AF004 | 0.0738 |
| AF005 | 0.0098 |
| Reservoir | 0.0623 |
| Tubneh Pump | 0.0459 |
| Dair Abu Saied Pump | 0.0509 |
| Sammou Pump | 0.0541 |
| Tubneh Homes | 0.0279 |
| Dair Abu Saied Homes | 0.0344 |
| Sammou Home | 0.0377 |
The recommended Reference Dose Level (RDL) of the effective dose is 0.1 mSv/year resulting from the consumption of drinking water (the possible total radioactive contamination of the annual drinking-water consumption) [24]. Figure 8 shows the total annual effective dose of all water sample sources.

Figure 8: The total annual effective dose of all water sample sources
The results show that the total annual effective dose of all water sample sources was less than the maximum recommended limit of radon exposure. However, the most risk source was at Ayoon Al-Hammam 1 with an exposure of (0.0803 mSv/y) of radon gas while the safest source was at Tubneh village(0.0279 mSv/y) because it has the minimum annual effective dose.
Estimation of the lung cancer risk factor
Table 6 and Figure 9 show the risk factor of lung cancer from radon exposure, and the potential numbers of the population to develop lung cancer by radon gas inhalation and ingestion, which ranges 1 persons-5 persons/100,000 of citizens.

Figure 9: The risk factor of lung cancer from Radon exposure (number of a person developing lung cancer /100, 000 citizens)
TABLE 6. A risk factor of lung cancer from radon exposure (person per 100,000 citizens)
| Source | Average of Radon gas concentration (Bq/l) | The risk factor of lung cancer from radon exposure |
|---|---|---|
| AF001 | 4.9 | 5 |
| AF002 | 1.4 | 1 |
| AF003 | 4.7 | 5 |
| AF004 | 4.5 | 4 |
| AF005 | 0.6 | 1 |
| Reservoir | 3.8 | 4 |
| Tubneh pump | 2.8 | 3 |
| Dair Abu Saied pump | 3.1 | 3 |
| Sammou pump | 3.3 | 3 |
| Tubneh tap water |
1.7 | 2 |
| Dair Abu Saied tap water | 2.1 | 2 |
| Sammou tap water |
2.3 | 2 |
Conclusion
The highest risk of lung cancer was at Ayoon Al-Hammam 1 well # 1, and Sammou town. However, mechanical aeration should be added to the Ayoon Al-Hammam water purification plant before collecting the groundwater at the reservoir. This step is not expensive, although it can remove radon gas, and greatly improve the drinking water quality
References
- Abu-Khader MM, Shawaqfeh AT, Naddaf Z, et al. Radon in the groundwater in the Amman-Zarqa Basin and related environments in Jordan. Groundw. Sustain. Dev. 2018;7:73-81.
- Knoll GF. Radiation Detection and Measurementerd edition John Wiley and Sons. New York. 2000.
- Al-Zoughool M, Krewski D. Health effects of radon: a review of the literature. Int. j. radiat. biol. 2009, 85(1), 57-69.
- Kadhim IH, Al-shimmary IH, Al–Bodairy OH. Study the concentration of radon gas in groundwater in the selected samples of the province of Babel/Iraq. Environ. Sci.: Indian J. 2016;2:79-82.
- Keramati H, Ghorbani R, Fakhri Y, et al. Radon 222 in drinking water resources of Iran: a systematic review, meta-analysis and probabilistic risk assessment (Monte Carlo simulation). Food chem. toxicol. 2018;115:460-9.
- Przylibski TA, Domin E, Gorecka J, et al. 222Rn concentration in groundwaters circulating in granitoid massifs of Poland. Water. 2020;12(3):748.
- Gundersen LC, Schumann RR, Otton JK, et al. Geology of radon in the United States. Geol Soc Am Spec Pap. 1992;271:1-6.
- Choubey VM, Sharma KK, Ramola RC. Geology of radon occurrence around Jari in Parvati valley, Himachal Pradesh, India. J. environ. radioact. 1997;34(2):139-47.
- Gall IK, Ritzi Jr RW, Baldwin Jr AD, et al. The correlation between bedrock uranium and dissolved radon in ground water of a fractured carbonate aquifer in southwestern Ohio. Groundwater. 1995;33(2):197-206.
- Sukanya S, Noble J, Joseph S. Factors controlling the distribution of radon (222Rn) in groundwater of a tropical mountainous river basin in southwest India. Chemosph. 2021;263:128096.
- Sola P, Srisuksawad K, Loaharojanaphand S, et al. Radon concentration in air, hot spring water, and bottled mineral water in one hot spring area in Thailand. J. Radioanal. Nucl. Chem. 2013;297(2):183-7.
- Bersimbaev RI, Bulgakova O. The health effects of radon and uranium on the population of Kazakhstan. Genes Environ. 2015;37(1):1-0.
- PAnghAl A, VirKAr K, KumAr V, et al.Development of probiotic beetroot drink. Current research in nutrition and food science journal. 2017;5(3).
- Adithya VS, Chidambaram S, Prasanna MV, et al. Health risk implication and spatial distribution of radon in groundwater along the lithological contact in south India. Archives of environmental contamination and toxicology. 2021;80(1):308-18.
- Badhan K, Mehra R, Sonkawade RG. Measurement of radon concentration in groundwater using RAD7 and assessment of average annual dose in the environs of NITJ, Punjab, India. 2010;
- Bersimbaev R, Pulliero A, Bulgakova O, et al. Radon biomonitoring and microRNA in lung cancer. Int. j. mol. sci. 2020;21(6):2154.
- Abdel-Razeq H, Attiga F, Mansour A. Cancer care in Jordan. Hematol./oncol. stem cell ther. 2015;8(2):64-70.
- Ahmed, M. T. Hydrogeological and Hydrochemical Modeling of Wadi Zeglab Catchment NW-Jordan (Doctoral dissertation, Yarmouk University).2019
- Galmed MA, Aly MF, Smadi A, et al. Taphonomic and diagenetic aspects of the Late Cretaceous Libycoceras ismaeli (Zittel) from Northern Jordan. Arab. J. Geosci.2013;6(2):573-83.
- Hassan NM., & Hafez AF. Studying the physical parameters of a solid state nuclear track detector. J. Korean Phys. Soc. 2013;63(9), 1713-1719.
- Al-Bataina BA, Ismail AM, Kullab MK, et al. Radon measurements in different types of natural waters in Jordan. Radiat. Meas. 1997;28(1-6):591-4. [Google Scholar]
[CrossRef]
- Mahmoud, Z; Al Bataina, Barakat Atwan. Measurement of Radon Gas Concentration in Disi Water. 2018
- KozÅ?owska B, Walencik A, Dorda J, et al. Radon in groundwater and dose estimation for inhabitants in Spas of the Sudety Mountain area, Poland. Applied radiation and isotopes. 2010 ;68(4-5):854-7.
- US-EPA. Basic Information about Radon in Drinking Water 2014
- Gesell TF, and Prichard HM. (1975). The technologically enhanced natural radiation environment. Health phys, 1975,28(4), 361-366.
- World Health Organization. (2004) The World health report: 2004: changing history. World Health Organization.