Effect of the Nanoparticles on the Electrical Properties of Electrical Insulator Varnish
2 Electrical Technology Department, Faculty of Technology and Education, Helwan University, Cairo 11281, Egypt, Email: Awad_2010@techedu.helwan.edu.eg
3 Basic Science Department, Faculty of Technology and Education, Helwan University, Cairo 11281, Egypt, Email: Ahmed_Ali_2010@techedu.helwan.edu.eg
Received: 06-Jul-2020 Accepted Date: Jul 07, 2020; Published: 15-Jul-2020
This open-access article is distributed under the terms of the Creative Commons Attribution Non-Commercial License (CC BY-NC) (http://creativecommons.org/licenses/by-nc/4.0/), which permits reuse, distribution and reproduction of the article, provided that the original work is properly cited and the reuse is restricted to noncommercial purposes. For commercial reuse, contact reprints@pulsus.com
Abstract
Influence of nanoparticles of transition metal oxides on varnish samples has been investigated. The nanoparticles prepared by powder metallurgy method, followed by calcination at 70℃. The nanoparticles of ZnO, Al2O3 and TiO2 added to varnish with contents of 0, 0.1, 0.2, 0.3 and 0.4 to study the structural, morphology, dielectric and optical properties. X-ray diffraction data shows different crystal structure as well as particle sizes and ship. Optical properties were investigated using Raman spectrum and UV/Vis spectroscopy, which shown different spectra of Raman and absorptions for all samples. Moreover, dielectric properties data of the samples confirmed enhancement of varnish properties with doping level and types of metal oxide nanoparticles. Based on the experimental results, the additive of metal oxides nanoparticles for the varnish is good for electric motor insulation layers application.
Keywords
Vitrification; Warming; Failure of ejaculation; Pregnancy
Introduction
Recently, the nanotechnology of the polymers enables us to make new industrial devices and many of electrical applications due to their better mechanical, thermal and barrier properties [1-4]. Nanoparticles have been used in many applications because of their excellent behaviour of electrical properties with the small sizes. Moreover, the reduced charge mobility of the dielectric properties of polymers are due to the large development of surface activity. Which make the results in the electrical properties [5-7]. Nanocomposites of metal oxide and polymers can congregate to develop the chine length of polymer, that particles can decrease the space charge densities. As we can expected the Nano size of metal oxide in polymers can decreases Maxwell-Wagner interfacial polarization. Based on the above information polymer nanocomposites for dielectric applications are very promising materials [8-12]. One of the most important polymers is the varnish which is used in industry of the insulation in electric motors [13,14].
Varnish is a liquid polymer that when applied to a surface dries to form a hard lustrous typically transparent coating. Varnish is a clear transparent hard protective finish or film. However, some varnish products are marketed as a combined stain and varnish. Varnish is primarily used as electrical insulator for motors and other applications.
Varnish thermally solidified usually glossy but may be designed to produce satin or semi-gloss sheens by the addition of "flatting" agents. If we modified the varnish by nano fillers it may be useful for the new electrical motor’s applications. This motivated us to search for enhancement of varnish using different types of nano-metals and additive different ratios. Depending on the above information the dielectric properties of varnish have been improved, by an incorporation of various nano-fillers. We fabricated the varnish based composite doped with nano-sized metals to improve insulation behaviours at high temperature.
Valery I. Levitas et al. [15-18] reported a developing theory of large strains and lattice rotations called “ A phase-field theory ” of transformations between martensitic variants and multiple twinning within martensitic variants. The model allows one to prescribe the twin interface energy and width, and to introduce interface stresses consistent with the sharp interface limit. The model is very important to explain the electric phase transitions of the polymer with adding nanoparticles of metal oxide.
In this work, we fabricated and characterized metal oxide-nano-sized composites with different contents of nanoparticles for electrical motor application using powder metallurgy method. X-Ray diffraction (XRD) and scanning electron microscopy (SEM) have been used for investigating the characterization of the composites. The dielectric properties as well as the optical properties were studied at room temperature. Moreover, Infra-Red spectroscopy was done on the composites. The correlation between the dielectric and structural properties has been discussed.
Materials and Methods
Materials
Metal oxide powder (ZnO, Al2O3 and TiO2) with an average particle size of 50-100 nm was prepared. A specific particle size less than 53 mesh, used as matrix material to manufacture (Al-Gomhoria Co. LTD, Cairo, Egypt) the nanoparticles composite of metal oxide using metallurgical method. The used powders were well mixed in a mortar ceramic for 30 min, then the mixture were dried in furnace at 60℃ for 1hr, the powder metal oxide has dissolved in Methyl Alcohol at 70℃ using heater with magnetic starrier for 3 hours. The solution was dried in muffle furnace at 600℃. The resultant powder has been mixed with Methyl Alcohol at room temperature and heated at 70℃ with continues string until we got vogues solution. Then the solution mixed with the solution of varnish with the ratio of varnish solution using the ultrasonic radiation by wet co-precipitation method. Then the solution becomes participation with Ph. = 7.
Composite fabrication
Various composites were prepared containing various contents of Metal oxides (ZnO, Al2O3 and TiO2) and varnish. The solution becomes sol gel which has been used to coat the Cu-plate surface. XRD, SEM, and optical properties measured on the coated cu-plate. However, to investigate the dielectric and electrical properties we have coated the sample with silver paste.
Composite characterization
Microstructure (SEM) and XRD investigations
The microstructure of the samples was investigated by scanning electron microscope (SEM) at Nanotechnology Research Center, British University in Egypt (FE-SEM; QUANTAFEG250, Holland). The phase constituent of the specimens was identified by X-ray diffraction analysis Model D-5000 diffractometer using CuKα radiation and operated at 30 kV and 30mA.
Raman Spectroscopy
Raman spectroscopy has been investigated for the nanoparticles and varnish without nanoparticles (virgin) in the range of 200 to 800 nm wavelengths using Raman spectroscopy (Model at NRC, British University in Egypt)
Optical Properties
Optical properties (UV/Vis.) of the sample have been measured in the range of wavelengths from 300 nm to 800 nm using (Model Cary series UV/Vis. Spectroscopy at NRC, British University, Egypt). Using Absorption, we have comparing the absorptions with energy for all samples.
Dielectric properties
Dielectric measurements were investigated using RCL Meter Bridge at Fayoum University, Egypt (Tohako Model in Japan) in the frequencies range of 100 Hz to 10 MHz at room temperature.
Results and Discussion
X-Ray Diffraction (XRD):
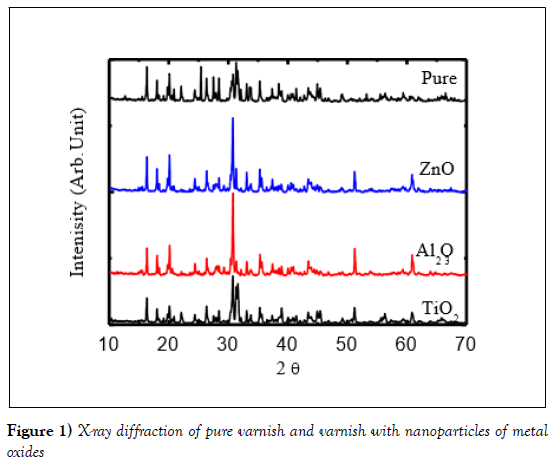
The phase constituent of the specimens was identified by X-ray diffraction analysis Figure 1 shows a combination of the XRD patterns of the varnish pure, 0.2 doped with Al2O3, ZnO and TiO2. It was observed that typical identical pattern was obtained with different types of peaks for the presence nanoparticles of metal oxides. The detected phases are the tetragonal and monoclinic phases have been changed with metal oxides doped in varnish peaks were appeared without any additional peaks of contaminations. There are peaks disappeared with adding the metal oxide nanoparticles such as peaks at 2θ=22.04, 48.91 and 66.67, whiles, some peaks appeared in the samples with metal oxide nanoparticles likes peaks at 2θ=60.98 and 51.25. This data confirmed changed in the structure with adding metal oxide nanoparticles.
Figure 1: X-ray diffraction of pure varnish and varnish with nanoparticles of metal oxides
The XRD pattern has been analysed using Match program software and all parameters have been tabulated in (Table 1). From the data in Figure 1 and Table 1 it is very clear that the nanoparticles were detected in the samples of varnish network. As one can note from Table 1 that, the structure of all samples is changed with doping of metal oxide nanoparticles from tetragonal–triclinic- monoclinic- orthorhombic. Moreover, the structure is changed with the type of nanoparticles of metal oxides. This experimental data confirmed the effect of strain of nanoparticle with twining of lattice which agrees with the theoretical studies of reports [15-19]. Whish can be expected to change the physical properties of varnish for electrical application.
| Sample | Crystal | Spacel group | A (Å) | B (Å) | C (Å) | Partcle sizes (nm) |
| Pure | tetragonal | I 41/a | 13.0970 | ---- | 13.7550 | 6.6 |
| ZnO | triclinic (anorthic) | C -1 | 9.8793 | 10.5298 | 12.2257 | 20.06 |
| TiO2 | orthorhombic | F d d d | 14.2430 | 13.0450 | 33.4839 | 2.26 18.55 |
| AL2O3 | monoclinic | C 1 2/c 1 | 9.4278 | 8.5651 | 5.2262 | 2.47 |
Table 1) Microstructure of the samples
Microstructure Investigations:
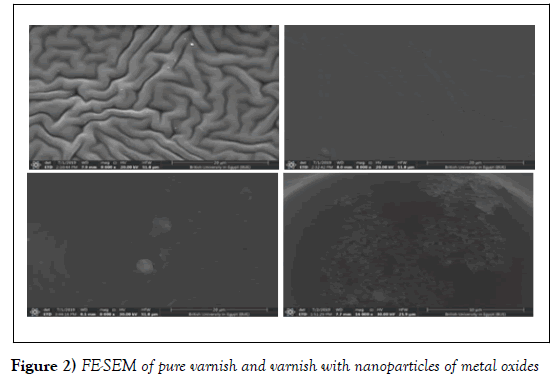
The microstructure of the samples was investigated by scanning electron microscope (FE-SEM) to study the effect of the nanoparticles in varnish and show the surface of the samples. FE- SEM micro photographs of pure, TiO2, Al2O3 and ZnO matrix with same percentage of metal oxides composites are shown in Figure 2 (a–d), respectively. From the micro photographs it is observed that pure sample shows the distributed homogeneously throughout the varnish and there are the tubes-like with diameter around 6.6 μm and length 15.46 μm. The samples with nanoparticles such as TiO2 the tubes are covered with the nanoparticles and little micro-tubes appeared with the average length of 18.55 and average diameters 2.26 μm. But the sample with Al2O3 some particles appeared over the varnish with the size of 2.47 μm, the sample with ZnO there is different sheep appeared with nano-size of around 20.06 nm. From this data the sample with ZnO shows nanostructure while all samples showed micro- structure. This changed in the sheep of the samples is due to structural phases (tetragonal – triclinic- monoclinic- orthorhombic) as in (Table 1).
Figure 2: FE-SEM of pure varnish and varnish with nanoparticles of metal oxides
It was also observed that by changed the metal oxide particles (TiO2) picture (B) the nanoparticles covered partially the surface and the porosities is decreased this is may be the because of the particles size of metal oxide in the nano-scale. While in picture (C) of Al2O3 covers the entire surface with homogeny of nanoparticles. But in case of ZnO, the surface is ZnO appeared on the surface of the varnish. All samples investigated with the same voltage with the same scale except the ZnO sample due to the small particle size. The particle sizes of composites are tabulated in (Table 1). Our data is in agreement with a phase field theory for the motion of the elastic material which undergoing twinning for large strains and lattice rotations, which appeared in the different shape of the SEM pictures due to different strain [15,16].
Raman Spectroscopy
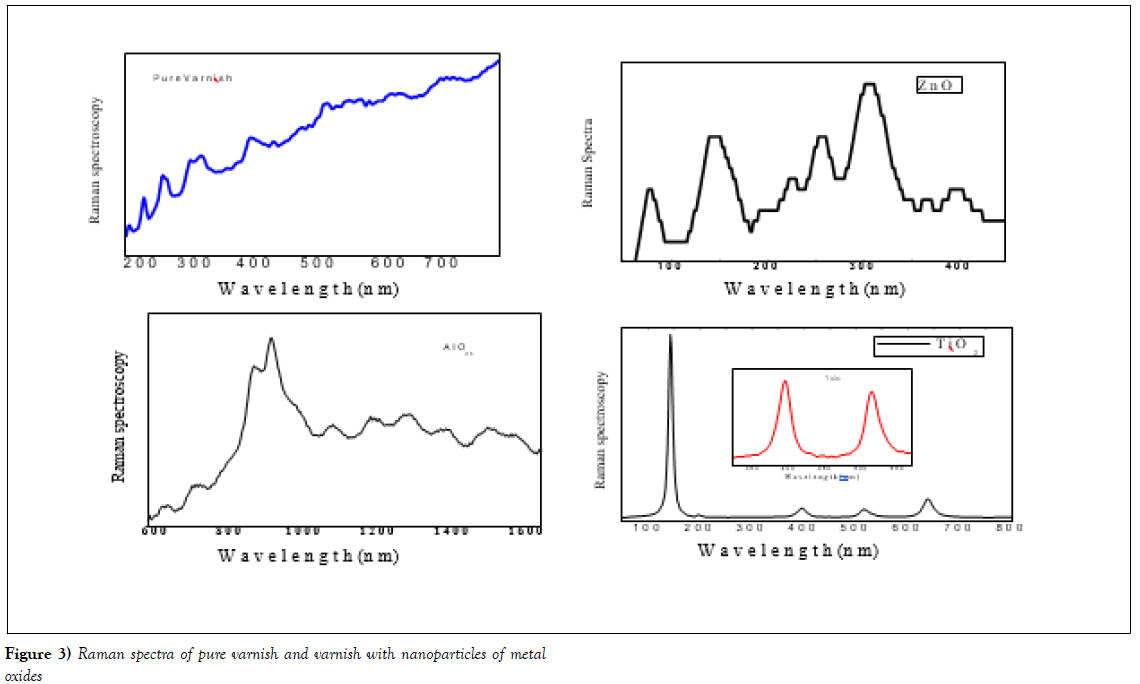
Raman spectroscopy has been investigated for the nanoparticles and varnish without nanoparticles (virgin) in the range of 200 to 800 nm wavelengths using Raman spectroscopy (Model at NRC, British University in Egypt). Raman spectroscopy can be good technique to characterize and study vibrational of nanostructures, both pure and doped samples. The Raman data is presented in Figure 3 shakes the sample 1 pure varnish has small peaks zigzag-like at wavelength around 200 to 450 nm due to the nature of polycrystalline of varnish and its H-O-H, R-3H and Vinyl - 3H, while the samples with nano metal oxide the peaks appeared due to the oxides in the varnish network at wavelength around 75, 150, and 350 for sample with ZnO. But samples with Al2O3 showed a few peaks around 850 and 950 nm which due to the metal oxide of (Al2O3). On the other hand, the sample with TiO2 showed very clear peaks at wavelength of 150, 400, 550 and 650 nm which are the mean peaks of TiO2 nanoparticles. This data confirmed that our sample preparation agrees with the references [20,21]. The parameters of a Raman mode, for example, frequency and line width, provide the basic information on the sample quality, specific aspects of lattice dynamics such as isotopic effects and phonon lifetimes [19], position of doping ions in the host lattice, as well as on the presence of impurities which are undetectable by X-ray analysis [22,23]. The micro-Raman spectra of the samples were measured in the backscattering configuration and analysed using Jobin YvonT64000 spectrometer, equipped with nitrogen cooled charge coupled-device detector. As an excitation source we used the 514.5 nm line of an Ar-ion laser. The measurements were performed at laser power densities, namely at 159, 318,637, and 955 kW/cm.
Figure 3: Raman spectra of pure varnish and varnish with nanoparticles of metal oxides
Optical Properties (UV/Vis.)
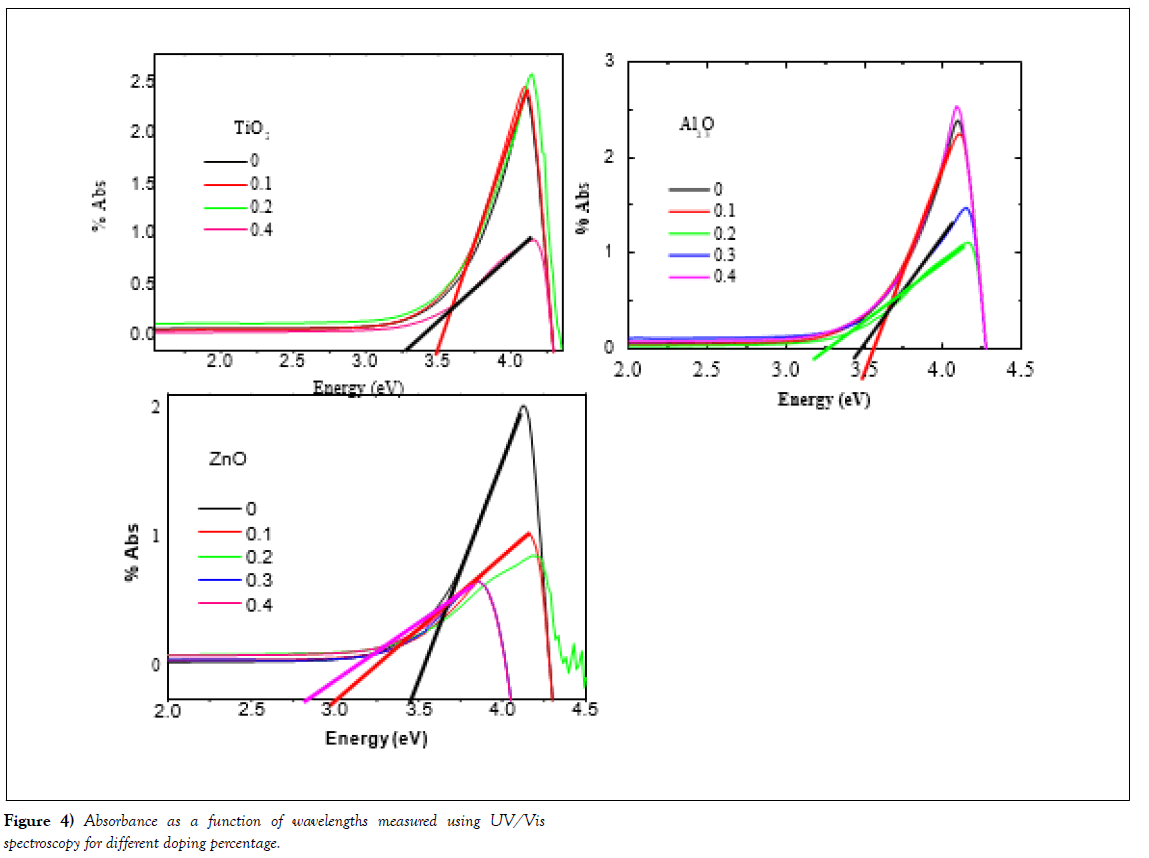
Optical properties (UV/Vis.) of the samples have been measured in the range of wavelengths from 300 nm to 800 nm using (Model Cary series UV/Vis. Spectroscopy at NRC, British University, Egypt). Figure 4 shows the absorption spectrum of varnish without additive and with nanoparticles of metals oxide.
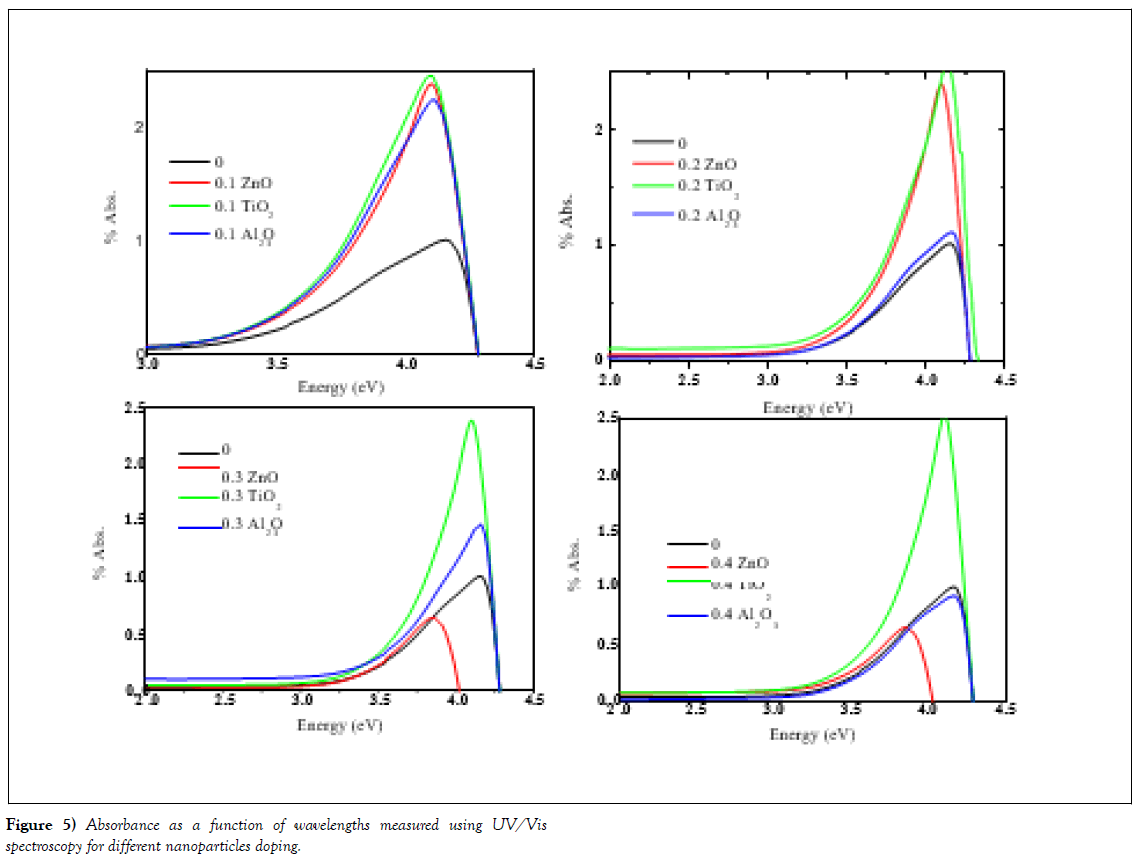
Using Absorption, we have comparing the absorptions with energy for all samples. The absorption of samples seems to be typical optical behaviour of a wide-band gap semiconducting oxide. The absorption spectra exhibited one sharp peak around 3.5 ~ 4.5 eV.
The absorption coefficient (α) of these investigated films was calculated from both the transmittance and reflection spectra as follow [24]:

where d is the film thickness, R and T are the reflectance and the transmittance for these films. The optical energy gap (Eg) is determined from the absorption spectra curves using the empirical equation [25]:

where A is a constant, Eg is the energy band gap, ν is the frequency of the incident light and h is Planck's constant. The constant P takes different values depending on the kind of optical transition of these films. P=0.5 for direct allowed transition (direct energy gap) and for indirect allowed transition the value of P will equal 2.
This indicates that samples in UV region there are heavily- absorption and in the visible region the samples absorbed moderately. The optical absorption in the shorter wavelength region is mainly due to the electron transition from the top of the valence band to the bottom of the conduction band. The data is presented at Figure 4(a-c). As one can see the TiO2-doped samples in panel (a) with the doping levels (0, 1, 2, 4% mole.) shows in the low range of energy less than 3 eV the absorption is constant for all samples. Moreover, the sample starts for absorption at energy 3.5 eV, which are nearly the band gap energy of the samples. This data indicated that the nanoparticle of TiO2 absorbed energy to move from the valance band to conduction band. We can noted that very important point is appeared here, for sample doped with level 0.4, the absorption level is the decreased, in addition to, the band gap decreased to become 3.25, which means the varnish material is saturated from nanoparticles, that made new level between the valance band and conduction band which reflected in the decreasing of band gap energy from 3.5 to 3.25 eV.
In the same absorption data, the sample doped with Al2O3 exhibited same behaviours such as the position of the sharp peak, but the beak is shafted to higher energy. Moreover, the band gap energy is shafted from 3.6 eV for the sample doped at 0.1 and 0.2 to become 3.4 and 3.25 eV at higher doping levels of 0.3 and 0.4.The interpretation of the decrease of band gap energies is explained above for the sample of TiO2.
(Figure 4 (c)) shows the samples doped with ZnO nanoparticles. In the case of samples doped with ZnO the amount of absorption is decreased more than the undoped and samples doped with Al2O3 and TiO2. In addition to, the value of band gap energy is decreased too. The higher levels of doping again show saturation of nanoparticles which is reflected in the decreases of band gap energies.
(Figure 5) presented the investigated samples of undoped and doped samples with different nanoparticles (TiO2, Al2O3 and ZnO). In this data, we compare the same doping levels of different nanoparticles types. The data shows the effect of doping level of 0.1 mole. % nanoparticles on the absorption, this is clearly show increases of the absorption more than the undoped sample (panel (a)). However, in penal (b) the doped level is 0.2 shows the ZnO and TiO2 have much absorption than the undoped sample and the sample with Al2O3. While in panels (c) and (d) the samples with TiO2 nanoparticles oxides shows same absorption levels like 0.1 and 0.2, on the other hand, the other samples show decreases of the absorption. This means that the good level for doping nanoparticles for varnish is 0.1 and 0.2 which give higher absorption and suitable energy band gaps. This data confirmed the enhancement of the behaviour of the varnish with the doping of nanoparticles at level 0.1 and 0.2.
Figure 5: Absorbance as a function of wavelengths measured using UV/Vis spectroscopy for different nanoparticles doping.
Dielectric properties
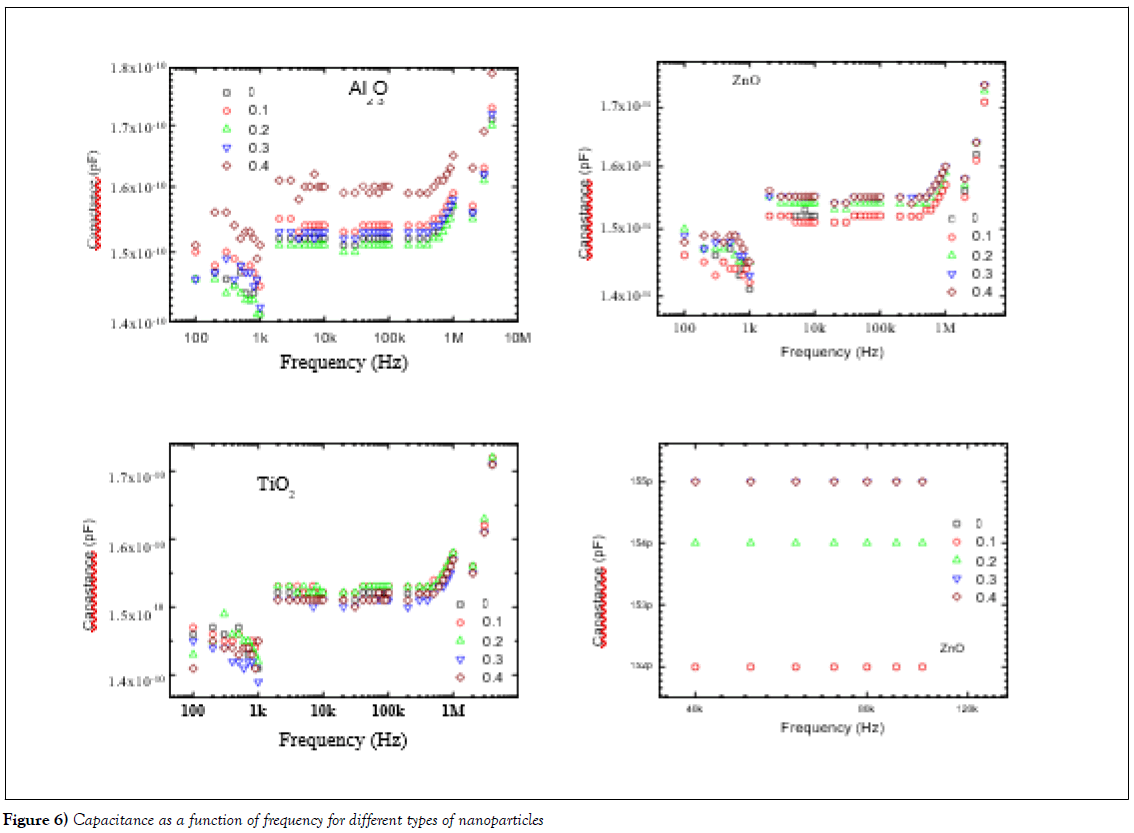
Dielectric measurements were investigated using RCL meter bridge (Tohako Model ET4410 at Fayoum University, Egypt) in the frequencies range of 100 Hz to 10 MHz at room temperature. The data is presented in Figure 6(a-d) shows the effect of the doping level and type of metal oxide on the dielectric properties such as capacitance and Ac resistivity for all samples. Panel (a) shows the undoped sample and Al2O3-doped samples (0.1, 0.2, 0.3 and 0.4 mole %) at different level of doping. We can see here three regions of frequencies effect, firstly, the Hertz-region start from 100Hz to 1 kHz, there is decreasing in the capacitance with increases in the frequencies, more over there is increases in the capacitance –value with increasing with level of doping of Al2O3, which is reflected in the sample of doping with 0.4 Al2O3. Secondly, the kilohertz region which starts from 1 kHz up to 1000 kHz, the data shows systematic change in the capacitance with the doping level, the sample with doping level 0.4 shows higher capacitancevalue. Moreover, the other levels of doping show constant-like behaviour of dielectric properties with frequencies. Thirdly, the mega Hertz region starts from 1 MHz up to 10 MHz, the data shows increases of capacitance with increasing the frequencies, and the doping level of Al2O3 has no effect of the value of capacitance. The panel (b) presented the samples doped with ZnO nanoparticles, this behaviour almost like Al2O3 behaviour for capacitance measurements. On the other hand, the panel (c) shows the capacitance measurements with frequencies, this data shows the same behaviour of other nanoparticles such as Al2O3 and ZnO behaviours, but there is no much effect of doping level on the value of capacitance of varnish from TiO2 nanoparticles. Finally, the panel (d) shows the effect of doping level of ZnO on the capacitance measurements at kilo-Hertz region, the data shows change in the capacitance –value with the level of doping.
Ac Electrical Conductivity
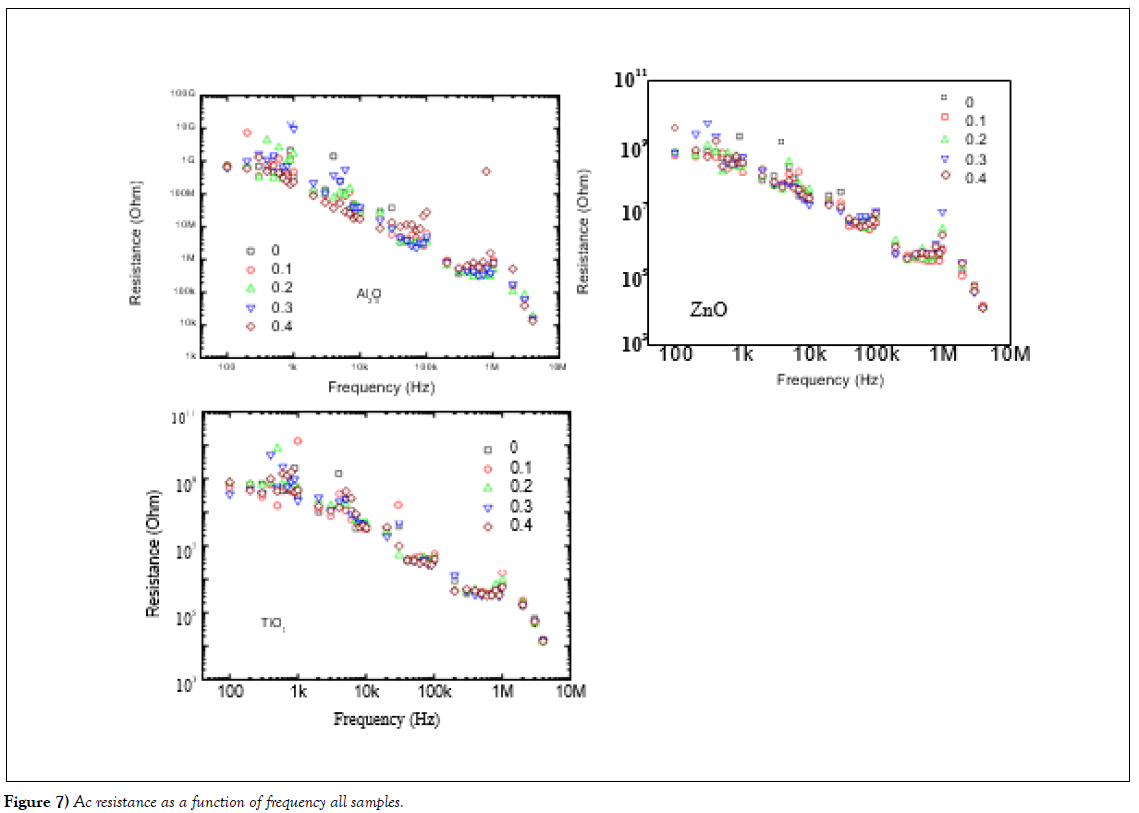
The Ac electrical resistivity of the nanoparticles doped in varnish was measured in the range of frequencies 100 Hz to 10 MHz is presented in (Figure 7 (a-c)). The resistivity (ρ) was measured using RCL meter bridge (Tohako Model made in Japan at Fayoum University, Egypt). Where R the resistance in Ω and it shows decreases in the R-value with the frequencies, it is the decreases with the frequencies related to the doping of the metal oxide nanoparticles which made leakage current decreased the resistance and increased the conductivities of all samples.
Conclusion
To conclude, varnish and doped varnish with nano-metals oxides (Al2O3, ZnO and TiO2 with doping levels 0.1, 0.2, 0.3 and 0.4 mole) have been synthesized using solvent method. The samples characterized using XRD as well as FE-SEM, the data shows different crystal structure as well as particle sizes and ship. Optical properties were investigated using Raman spectrum and UV/Vis spectroscopy, which shows different spectra of Raman and absorptions for all samples. Moreover, dielectric properties of the above samples have been investigated. The data confirmed enhancement of varnish properties with doping level and types of metal oxide nanoparticles. The varnish with nano-metals oxides made varnish to be more effect for application of electric motor insulation layers.
Acknowledgement
Authors would like to thank, Professors Arafa Hassan and Ahmed Baker for their help during measurements of dielectric properties at Fayoum and Helwan Universities, Egypt.
REFERENCES
- Pielichowski K, Leszczynska A. Polimery 2006;51:143.
- Golebiewski J, Rosanski A, Galeski A. Badanie procesu wytwarzania nanokompozytu polipropylenu z montmorylonitem. Polimery. 2006;51(5):375-381.
- Lepot N, Van Bael M. K, Van den Rul H et al. Polimery. 2006;51:662.
- Pigowski J, Kiersnowski A, Doega J. Polimery2006;51:705.
- Tanaka T, Montanari G. C, Mülhaupt R. Polymer nanocomposites as dielectrics and electrical insulation-perspectives for processing technologies, material characterization and future applications. IEEE Trans. Dielectr. Electr. Insul. 2004;11(5):763.
- Tanaka T, Kozako M, Fuse N. Proposal of a multi-core model for polymer nanocomposite dielectrics. IEEE Trans. Dielectr. Electr. Insul. 2005;12(5):669.
- Roy M, Nelson J. K, MacCrone R. K. Polymer Nanocomposite Dielectrics – The Role of the Interface. IEEE Trans. Dielectr.Electr. Insul. 2005;12(4):629.
- Hu J, Lu J. Smart Polymers and their Applications.2014.
- Thaminimulla C.T.K, Takata T, Hara M. Effect of Chromium Addition for Photocatalytic Overall Water Splitting on Ni–K2La2Ti3O10. J. Catal. 2000;196 (2):362-365.
- Nelson K. Utracki L. A. Mac Crone R. K et al. “Role of Interface in Determining the Dielectric Properties of Nanocomposites”.
- Fothergill J. C, Dissado L. A. “Nanocomposite Materials for Dielectric Structures”. 2004.
- Schandler L, Apple T. M, Bencewicz B. C et al. “Mechanical and Molecular Behavior of Nanoparticle/Polymer Composites”.
- Rubinstein, Michael, Colby et al. Polymer physics. Oxford University Press.2006.
- Ratzke S. Kindersberger J. “Erosion Behavior of Nano Filled Silicone Elastomers”, Proceedings of the XIVth International Symposium on High Voltage Engineering. SCRIBD. 2005.
- Valery I. Levitas, Arunabha M. R, et al. “Multiple twinning and variant-variant transformations in martensite: Phase-field approach”. Phys. Rev. 2013;88.
- Valery I. Levitas, Arunabha M. R, “Multiphase phase field theory for temperature- and stress-induced phase transformations”. Phys. Rev. 2015;91.
- Matsunaga K, Tanaka T, Yamamoto T et al. First-principles calculations of intrinsic defects in Al2O3. Phys Rev. 2003;68.
- Valery I. Levitas, Arunabha M. R. Multiphase phase field theory for temperature-induced phase transformations: Formulation and application to interfacial phases. Acta Materialia. 2016;105:244-257.
- Hadzic a B,Romcevic a N, Siberab D et al. Laser power influence on Raman spectra of ZnO(Co) nanoparticles. J. Phys. Chem. Solids. 2016;91:80–85.
- Cusco R, E. Alarcon-Llado, Ibnez J, et al. Temperature dependence of Raman scattering in ZnO. Phys Rev. 2007;75(16).
- Liu Y, MacManus-Drisoll J.L. Impurity control in Co-doped ZnO film through modifying cooling atmosphere. Appl Phys Lett. 2009;94.
- Bessekhouad Y, Robert D, Weber JV. Synthesis of photocatalytic TiO2 nanoparticles: optimization of the preparation conditions. J Photoch Photobio A. 2003;157:47–53.
- Farbod M, Alrasool M.K. Synthesis of TiO2 nanoparticles by a combined sol–gel ball milling method and investigation of nanoparticle size effect on their photocatalytic activities. Powder Technol. 2011; 214(3):344-348.
- Ali A.I, Ammar A.H, Abdel Moez A. Influence of substrate temperature on structural, optical properties and dielectric results of nano- ZnO thin films prepared by Radio Frequency technique. Superlatt Microstructu. 2014;65:285-298.
- Ali A.I, Son J.Y, Ammar A.H et al. Optical and dielectric results of Y0.225Sr0.775CoO3±δ thin films studied by spectroscopic ellipsometry technique. Results in Physics. 2013;3:167-172.


