Heavy metal contamination of the Cross River Estuary, Southeast Nigeria
2 Department of Physical Oceanography, University of Calabar, P.M.B. 1115, Calabar,, Nigeria
Received: 27-Jul-2023, Manuscript No. PULJEG-23-6617; Editor assigned: 31-Jul-2023, Pre QC No. PULJEG-23-6617 (PQ); Reviewed: 14-Aug-2023 QC No. PULJEG-23-6617; Revised: 15-Jan-2025, Manuscript No. PULJEG-23-6617 (R); Published: 22-Jan-2025
Citation: Emeka CN, Emeka VI. Heavy metal contamination of the Cross River Estuary, Southeast Nigeria. J Environmental Geol. 2024;8(1):1-6.
This open-access article is distributed under the terms of the Creative Commons Attribution Non-Commercial License (CC BY-NC) (http://creativecommons.org/licenses/by-nc/4.0/), which permits reuse, distribution and reproduction of the article, provided that the original work is properly cited and the reuse is restricted to noncommercial purposes. For commercial reuse, contact reprints@pulsus.com
Abstract
The spatial variation of heavy metals (Pb, Zn, Cu, Cd, Ni, Fe) in bottom waters of the Cross River Estuary were examined to understand the effect of anthropogenic pressures on the Estuary eco-system. The average concentrations of heavy metals in water followed the order of Fe>Zn>Ni>Cu>Cd>Pb. The concentrations of Pb, Zn, Cu, Cd, Ni, Fe are low and less likely to have negative effects on aquatic biota. Along channel profile of Cu and Fe demonstrated an increasing distance downstream while Pb and Cd showed an increasing upstream trend. A near uniform distribution was observed for Zn and Ni. Growing industrialization along the Estuary vicinity may lead to enhanced metal concentrations in the water thereby impacting negatively on the eco-system.
Keywords
Water; Pollution; Heavy metals; Contamination; Estuary
Introduction
A significant number of the world’s population and many industries are located along the coast, making the coastal ecosystem highly vulnerable to pollution. Coastal pollution can be derived from water and land-based sources. Water based sources include navigation, dredging and land reclamation, offshore crude oil and natural gas exploration while land-based sources may include oil terminals, gas plants, municipal and industrial development, tourism, beach creation, agricultural and defense activities [1]. Major pollutants generated from these sources are heavy metals, pesticides, toxic chemicals, garbage, oil sewage, radioactive wastes etc. These pollutants have harmful effects on the coastal eco-system causing harm to living resources, human health as well as affecting water quality. There is a growing need for environmental monitoring in view of the anthropogenic impacts of pollution on coastal and marine systems. The distribution of heavy metals in rivers and estuaries has been widely studied [2-6]. The distribution of heavy metals within the Cross River Estuary system had been investigated [7-9]. Ntekim et al., related elevated metal concentrations around industrial establishments to industrial effluents and metal leaching from refuse and municipal solid wastes. Essien et al., related high enrichment of V, Zn and Cr in Cross River Estuary sediments to industrial effluent discharge. In this study, the concentration of six heavy metals in water samples obtained from the Cross River Estuary is examined and compared with established reference values. Spatial distribution maps and along channel profiles of heavy metal levels in water within the Estuary are presented.
Materials and Methods
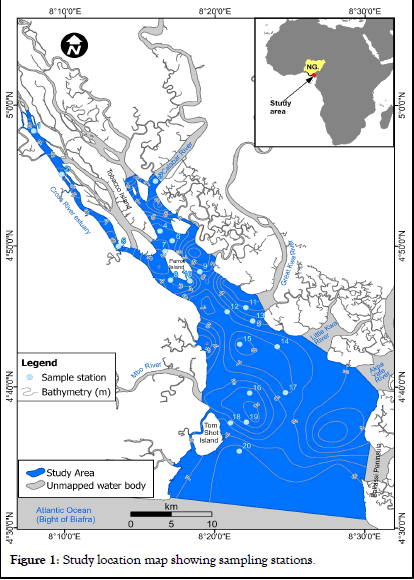
Twenty bottom water samples were collected from the Cross River Estuary using a Nansen bottom water sampler at geo-referenced sampling stations (Figure 1).
Bottom water samples were collected immediately above the sediment-water interface using a Nansen water bottle with an in-built thermometer. Samples were immediately transferred into pre-labelled plastic bottles and kept cool. In the laboratory, water samples were digested because of the presence of fine sediments in the water. 100 ml of the water sample was digested with 0.5 ml of dilute nitric acid and heated until the volume of the solution reduced to 20 ml. The solution was allowed to cool, and subsequently filtered into volumetric flask. Purified water was added to the volumetric flask until a volume of 100 ml was attained. The solution was transferred into a sample bottle and covered for heavy metal analysis. Heavy metals in water were analyzed using atomic absorption spectrometer (Unicam Model, SOLAAR 969). For quality control, the reagent blank and regular samples were measured and monitored under optimized conditions. Materials used for the analysis were thoroughly cleaned with non-ionic soap, HNO3 (5%) and distilled water following standard procedures recommended by APHA-AWWA-WEF [10]. All water samples were analyzed in duplicate, and the average values were calculated. Instruments were calibrated according to manufacturer’s recommendation. The descriptive statistics (minimum, maximum and mea concentrations) of heavy metals were calculated using Microsoft excel. Spatial distribution maps of heavy metals within the Estuary channel were plotted using ArcGIS.
Results and Discussion
Twenty representative bottom water samples from Cross River Estuary were analyzed to determine heavy metal (Ni, Fe, Pb, Cu, Zn and Cd) concentration trends within the channels. Heavy metal concentration values in water for Cu, Pb, Ni, Fe, Zn and Cd at each sampling stations are summarized in Tables 1. At Cross River Estuary, station 1represents the upper Estuary limits of the water sampling stations while station 20 represents the lower Estuary limits of the water sampling stations. The magnitude order of heavy metal concentrations in water for Cross River Estuary are summarized in Tables 1.
| Station | Cu (mg/L) | Pb (mg/L) | Zn (mg/L) | Cd (mg/L) | Ni (mg/L) | Fe (mg/L) | Magnitude order of metal concentration |
|---|---|---|---|---|---|---|---|
| 1 | 0.326 | 0.082 | 0.468 | 0.094 | 0.426 | 0.876 | Fe>Zn>Ni>Cu> Cd>Pb |
| 2 | 0.367 | 0.044 | 0.412 | 0.048 | 0.328 | 1.014 | Fe>Zn>Ni>Cu> Cd>Pb |
| 3 | 0.194 | 0.042 | 0.284 | 0.082 | 0.284 | 1.025 | Fe>Zn>Ni>Cu> Cd>Pb |
| 4 | 0.372 | 0.064 | 0.316 | 0.076 | 0.256 | 1.112 | Fe>Cu>Zn>Ni>Cd>Pb |
| 5 | 0.264 | 0.066 | 0.32 | 0.084 | 0.347 | 0.924 | Fe>Ni>Zn>Cu>Cd>Pb |
| 6 | 0.286 | 0.074 | 0.424 | 0.096 | 0.412 | 1.126 | Fe>Zn>Ni>Cu> Cd>Pb |
| 7 | 0.342 | 0.046 | 0.442 | 0.074 | 0.166 | 1.067 | Fe>Zn>Cu>Ni> Cd>Pb |
| 8 | 0.408 | 0.054 | 0.324 | 0.072 | 0.362 | 1.268 | Fe>Cu>Ni>Zn >Cd>Pb |
| 9 | 0.412 | 0.072 | 0.246 | 0.09 | 0.316 | 1.284 | Fe>Cu>Ni>Zn >Cd>Pb |
| 10 | 0.354 | 0.02 | 0.26 | 0.048 | 0.418 | 1.802 | Fe>Ni>Cu>Zn> Cd>Pb |
| 11 | 0.38 | 0.018 | 0.318 | 0.096 | 0.424 | 0.964 | Fe>Ni>Cu>Zn> Cd>Pb |
| 12 | 0.267 | 0.046 | 0.364 | 0.042 | 0.196 | 0.892 | Fe>Zn>Cu>Ni> Cd>Pb |
| 13 | 0.384 | 0.072 | 0.287 | 0.064 | 0.189 | 1.48 | Fe>Cu>Zn>Ni>Cd>Pb |
| 14 | 0.416 | 0 | 0.292 | 0.048 | 0.428 | 2.087 | Fe>Ni>Cu>Zn> Cd>Pb |
| 15 | 0.404 | 0 | 0.454 | 0.036 | 0.264 | 2.124 | Fe>Zn>Cu>Ni> Cd>Pb |
| 16 | 0.188 | 0.084 | 0.462 | 0.094 | 0.282 | 1.526 | Fe>Zn>Ni>Cu> Cd>Pb |
| 17 | 0.284 | 0.068 | 0.466 | 0.08 | 0.364 | 1.548 | Fe>Ni>Cu>Zn> Cd>Pb |
| 18 | 0.246 | 0.042 | 0.386 | 0 | 0.312 | 2.725 | Fe>Zn>Ni>Cu> Pb>Cd |
| 19 | 0.392 | 0.066 | 0.362 | 0 | 0.406 | 1.612 | Fe>Ni>Cu>Zn>Pb>Cd |
| 20 | 0.418 | 0.04 | 0.264 | 0.046 | 0.418 | 3.124 | Fe> Cu>Ni>Zn> Cd>Pb |
Table 1: Heavy metal levels in water along Cross River Estuary sampling stations.
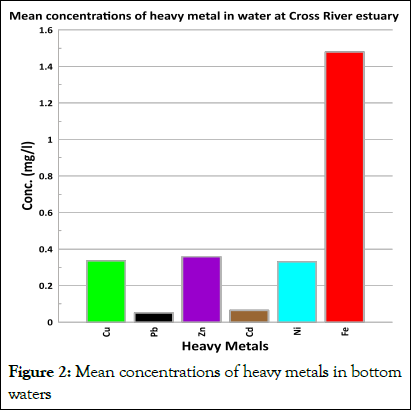
In Cross River Estuary, stations 1, 2, 3, 6 and 16, recorded Fe>Zn>Ni>Cu>Cd>Pb while at stations 4 and 13, Fe>Cu>Zn>Ni>Cd>Pb was observed. At station 5, Fe>Ni>Zn>Cu>Cd>Pb was observed while at stations 7, 12 and 15, Fe>Zn>Cu>Ni>Cd>Pb was recorded. At stations 8 and 9, Fe>Cu>Ni>Zn>Cd>Pb was recorded. At stations 10, 11, 14 and 17, Fe>Ni>Cu>Zn> Cd>Pb was recorded. At station 18, Fe>Zn>Ni>Cu> Pb>Cd was recorded. At station 19, Fe>Ni>Cu>Zn>Pb>Cd was recorded. At station 20, Fe>Cu>Ni>Zn>Cd>Pb was observed (Table 1). The mean values of Fe, Zn, Cu, Ni, Cd and Pb in water for Cross River Estuary are 1.479 mg/L, 0.358 mg/L, 0.335 mg/L, 0.330 mg/L, 0.064 mg/L, and 0.05 mg/L respectively (Table 2).
| Heavy metals in water | Minimum conc. (mg/L) | Maximum conc. (mg/L) | Mean conc.(mg/L) | WHO (2006, 2011) permissible limits | NIS (2007) |
|---|---|---|---|---|---|
| Cu | 0.188 | 0.418 | 0.335 | 2 | 1 |
| Pb | 0 | 0.084 | 0.05 | 0.05 | 0.01 |
| Zn | 0.246 | 0.468 | 0.358 | 3 | 3 |
| Cd | 0 | 0.096 | 0.064 | 0.003 | 0.003 |
| Ni | 0.166 | 0.428 | 0.33 | 0.02 | 0.02 |
| Fe | 0.876 | 3.124 | 1.479 | 0.3-1.0 | 0.3 |
Table 2: Heavy metal concentrations in water and maximum permissible limits.
Fe recorded the highest concentration values throughout all the sampling stations while Cd and Pb recorded the least concentrations in water. The ranking of the mean heavy metal levels in the water samples for Cross River Estuary are as follows: Fe>Zn>Ni>Cu>Cd>Pb (Figure 2).
Copper (Cu)
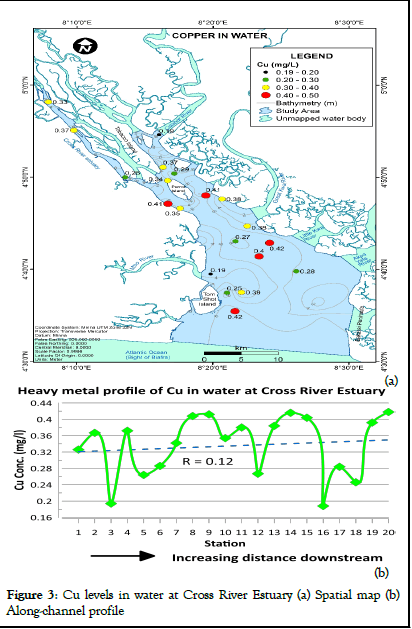
The concentration of copper in water at Cross River stuary ranged from 0.19 to 0.42 mg/l (mean=0.34 mg/l) as shown in Table 1. According to WHO report on guidelines for drinking water quality, this range falls within the 1993 WHO maximum permissible limits for copper concentrations in water (2 mg/l) [11]. Cu levels in water were also within the maximum permissible limits established by NIS [12]. The spatial distribution map and heavy metal profile of Cu levels in water at Cross River Estuary are presented in Figures 3a and b respectively. Higher concentration values of Cu were recorded towards the lower Estuary (Figure 3a). A variation in copper concentration was observed between sampling stations. However, copper levels in water at Cross River Estuary slightly increased with distance downstream (Figure 3).
Lead (Pb)
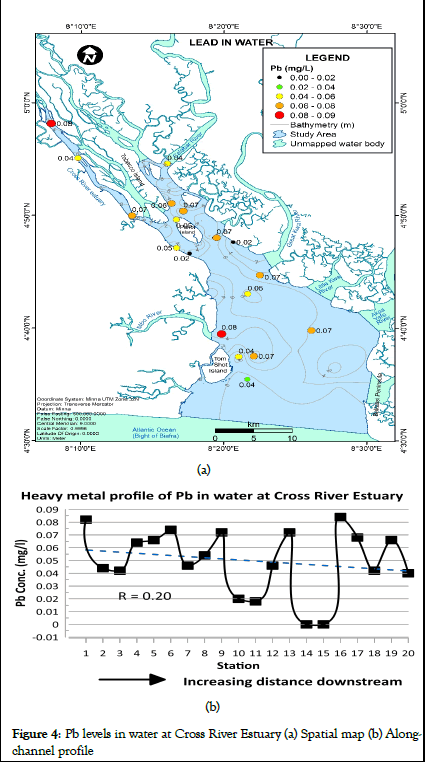
Lead concentration in water for Cross River Estuary ranged from 0.00 to 0.084 mg/L (mean=0.05 mg/L) as shown in Table 1. The spatial distribution map and heavy metal profile of Pb levels in water at Cross River Estuary are presented in Figure 4a and 4b respectively. Lead concentrations in water predominantly ranged from 0.040 to 0.080 mg/l throughout the channel (Figure 4a). Variations in the concentration of lead in water was observed between sampling stations (Figure 4b).
According to WHO report on guidelines for drinking water quality, the 1984 WHO maximum permissible limits for lead concentrations in water is 0.05 mg/l [13]. Lead values at stations 1, 4, 5, 6, 9, 13, 16, 17, and 19 exceeded the WHO maximum permissible limit of 0.05 mg/L (Figure 4b). Similar elevated concentrations of Pb in Cross River Estuary samples were reported by Ntekim et al. Pb levels in water were generally above the maximum permissible limits of Pb in water (0.01 mg/l) established by NIS. Based on mean concentration (0.05 mg/l), Pb levels in water were within the WHO maximum permissible limits. Pb levels in water for Cross River Estuary slightly decreased with increasing distance downstream (Figure 4). Higher concentrations of Pb upstream of the Estuary may be attributed to anthropogenic activities such as mari-time transportation services associated with emission of exhaust fumes and fuel drops from engine boats.
Zinc (Zn)
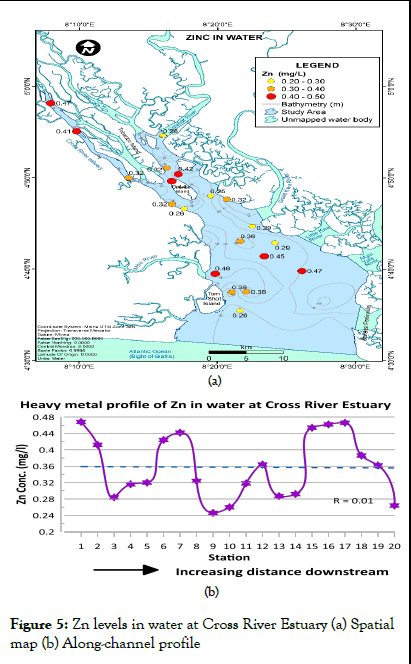
Zinc concentration in water at Cross River Estuary ranged from 0.25 to 0.47 mg/l (mean=0.36 mg/l) as shown in Table 1. According to WHO report on guidelines for drinking water quality, this range falls within the 1993 WHO maximum permissible limits for Zinc concentrations in water (3 mg/l). Zn levels in water were also within the maximum permissible limits established by NIS (2007). The spatial distribution map and heavy metal profile of Zn levels in water at Cross River Estuary are presented in Figure 5a and 5b respectively. Zn levels in water predominantly ranged between 0.300 and 0.470 mg/l (Figure 5a). There was no clearly defined trend in zinc concentration along the channel (Figure 5b). However, strong variations in zinc levels were observed between sampling stations.
Iron (Fe)
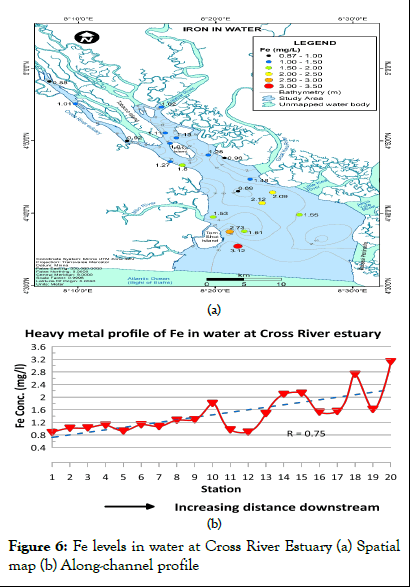
Iron concentration in water for Cross River Estuary ranged between 0.88 and 3.12 mg/l (mean=1.48 mg/l) as shown in Table 1. According to WHO report on guidelines for drinking water quality, Iron concentration values were above the 1993 WHO maximum permissible limits for iron levels in water (0.3 mg/l to 1.0 mg/l). Fe levels in water also exceeded the maximum permissible limits established by NIS. The spatial distribution map and heavy metal profile of Fe levels in water at Cross River Estuary are presented in Figures 6a and 6b respectively. Fe levels in water were predominantly 1.00 to 1.50 mg/l in the upper Estuary, increasing in concentration (1.50 to 3.20 mg/l) towards the lower Estuary (Figure 6). Iron concentration in water for Cross River Estuary generally increased in the downstream direction.
Nickel (Ni)
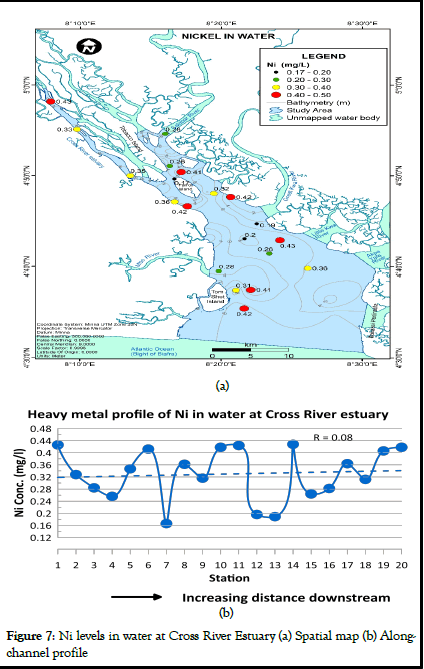
Nickel concentrations in water for Cross River Estuary ranged from 0.17 to 0.43 mg/l (mean=0.33 mg/l) as shown in Table 1. According to WHO report on guidelines for drinking water quality, this range exceeds the 1993 WHO maximum permissible limits for nickel concentration in water (0.02 mg/l). Ni levels in water also exceeded the maximum permissible limits established by NIS. Higher levels of Ni maybe associated with domestic and industrial effluent. The spatial distribution map and heavy metal profile of Ni levels in water at Cross River Estuary are presented in Figure 7a and 7b respectively. Nickel concentration in water predominantly ranged from 0.300 to 0.470 mg/l (Figure 7a). Strong variations in the concentration of nickel was observed between stations (Figure 7b). However, the concentration of nickel in water for Cross River Estuary slightly increased downstream (Figure 7).
Cadmium (Cd)
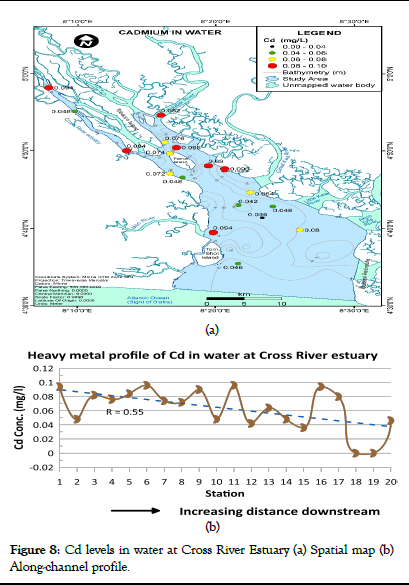
Cadmium concentration in water for Cross River Estuary ranged from <0.001 to 0.096 mg/l (mean=0.064 mg/l) as shown in Table 1. According to WHO, a value of 0.05 mg/l was suggested for cadmium in drinking water but this value was further lowered to 0.003 mg/l in 1993 based on health concerns. The spatial distribution map and heavy metal profile of Cd levels in water at Cross River Estuary are presented in Figure 8a and 8b respectively. Cadmium levels in water predominantly ranged from 0.060 to 0.096 mg/l within the upper Estuary and 0.036 to 0.080 mg/l within the lower Estuary (Figure 8a). Variations in Cd levels were observed between sampling stations (Figure 8b). Cadmium concentration values were generally above the WHO and NIS maximum permissible limits at most stations except at stations 18 and 19 where cadmium levels were very low (<0.001 mg/l) and within the 0.003 mg/l acceptable limits. Cadmium concentration in water for Cross River Estuary decreased with distance downstream (Figure 8).
Conclusion
Six heavy metals (Cu, Zn, Ni, Fe, Cd, Pb) were analyzed in 20 bottom water samples collected from the Cross River Estuary. Cu in water ranged from 0.19 to 0.42 mg/l (mean=0.34 mg/l); Pb ranged from 0.00 to 0.084 mg/L (mean=0.05 mg/L); Zn ranged from 0.25 to 0.47 mg/l (mean=0.36 mg/l); Fe ranged between 0.88 and 3.12 mg/l (mean=1.48 mg/l); Ni ranged from 0.17 to 0.43 mg/l (mean=0.33 mg/l) and Cd from <0.001 to 0.096 mg/l (mean=0.064 mg/l) for the Cross River Estuary. The mean concentration of heavy metals in the study area followed a decreasing order of Fe>Zn>Ni>Cu>Cd>Pb. Heavy metal concentrations are within the WHO permissible limits of heavy metals in water, indicating that there was minimal to no pollution of the study area. A continuous monitoring of heavy metal levels is recommended in view of the rise in industrialization within the vicinity of the estuarine eco-system.
References
- Pati P, Patra P. Benthic foraminiferal responses to coastal pollution: A review. Int J Geol Earth Sci. 2012;2(1):42-56.
- Eddy NO, Udo CL, Ukpong IJ. Heavy metals in sediments of the Cross River Estuary at Oron, South Eastern Nigeria. Afr J Environ Sci. 2004;3(1):6-10.
- Ip CC, Li XD, Zhang G, et al. Trace metal distribution in sediments of the Pearl River Estuary and the surrounding coastal area, South China. Environ Pollut. 2007;147(2):311-23.
[Crossref] [Google Scholar] [PubMed]
- Li Q, Wu Z, Chu B, et al. Heavy metals in coastal wetland sediments of the Pearl River Estuary, China. Environ Pollut. 2007;149(2):158-64.
[Crossref] [Google Scholar] [PubMed]
- Jia Z, Li S, Liu Q, et al. Distribution and partitioning of heavy metals in water and sediments of a typical Estuary (Modaomen, South China): The effect of water density stratification associated with salinity. Environ Pollut. 2021;287:117277.
[Crossref] [Google Scholar] [PubMed]
- Uwah IE, Dan SF, Etiuma R A, et al. Evaluation of status of heavy metals pollution of sediments in Qua-Iboe river Estuary and associated creeks, South-Eastern Nigeria. Environ Pollut. 2013;2(4):110-22.
- Ntekim EEU, Ekwere SJ, Ukpong EE. Heavy metal distribution in sediments from Calabar River, Southern Nigeria. Environ Geo. 1993; 21:237-41.
- Essien JP, Antai SP, Olajire AA. Distribution, seasonal variations and ecotoxicological significance of heavy metals in sediments of Cross River Estuary mangrove swamp. Water, Air, Soil Pollut. 2009;197:91-105.
- Dan SF, Udoh EC, Zhou J, et al. Heavy metals speciation in surface sediments of the Cross River Estuary, Gulf of Guinea, South East Nigeria. Marine Pollu Bull. 2022;185:114257.
[Crossref] [Google Scholar] [PubMed]
- Clesceri LS, Greenberg AE, Eaton AD. Standard Methods for the Examination of Water and Wastewater. 20th edition. American Public Health Association, Washington (USA); 1998.
- WHO. Guidelines for Drinking Water. 4th edition. Geneva: World Health Organization Press. 2011.
- NIS. Nigerian Standard for drinking water quality. Nigerian Industrial Standard Press, Nigeria. 2017.
- WHO. Guidelines for drinking water quality. First addendum to 3rd Edition, Volume 1. Geneva, World Health Organization. 2006.


