Study structural properties of Nanocomposite (polyvinyl alcohol\ (CdO/NiO) via sol-gel method
Received: 13-Nov-2022, Manuscript No. PULJNN-22-5791; Editor assigned: 15-Nov-2022, Pre QC No. PULJNN-22-5791 (PQ); Accepted Date: Jan 10, 2023; Reviewed: 18-Nov-2022 QC No. PULJNN-22-5791 (Q); Revised: 27-Dec-2022, Manuscript No. PULJNN-22-5791 (R); Published: 01-Mar-2023, DOI: 10.37532/puljnn.2023.7(1).1-6
Citation: Abdu Al-Jezbi AM. Study Structural Properties of Nanocomposite(polyvinyl Alcohol\(CdO/NiO) via sol-gel method. J Nanosci Nanomed 2023;7(1):01-06.
This open-access article is distributed under the terms of the Creative Commons Attribution Non-Commercial License (CC BY-NC) (http://creativecommons.org/licenses/by-nc/4.0/), which permits reuse, distribution and reproduction of the article, provided that the original work is properly cited and the reuse is restricted to noncommercial purposes. For commercial reuse, contact reprints@pulsus.com
Abstract
This study deals with the synthesis of some physical properties of (CdO/NiO) nanocomposite via Sol-Gel method and their antibacterial activities. The NiO and CdO nano oxides as well as the CdO/NiO oxide mixture were prepared in five samples with different concentrations where the ratio of CdO/NiO was [(1: 0), (3: 1), (1:1), (1: 3), (0: 1)], by using the gel solution by means of a Polyvinyl Alcohol Solution (PVA). The samples were plate limb at (500̊°C) for three hours. The structural properties of the prepared oxides resulting from the cracking process were studied. The XRD results showed the presence of pure cadmium oxide diffraction patterns in the sample (S1) as well as pure nickel oxide in the sample (S5), and confirmed the presence of the CdO / NiO oxide mixture in the samples (S2, S3, S4). The results of XRD also showed, through calculations, that the specific surface area increased with increasing granular size and decreased with decreasing granular size. XRD calculations also showed that the intensity of eruptions
decreased as the granular volume increased and, inversely, increased with decreasing granular size. Optical measurements were taken and absorption spectra at the wavelength (215 nm) within the UV range. The results of the optical measurements showed an increase in the energy gap of the mixture. Samples were taken for continuous electrical conductivity measurements.
Key Words
Nickel Oxide; Cadmium oxide; Sol-gel method; Nanocomposite; NiO/ PVA; CdO/PVA
Introduction
Nanoscale semiconductors are characterized by unique features and special properties in the field of Nano. Due to the development of modern technology, nanotechnology has become at the forefront of the most important fields, even though the widespread interest in nanotechnology dates back to 1996-1998, where particles less than 100 nm in size gave the substance, which is included in its composition new properties. Transparent Conductive Oxides (TCO) materials that are semiconductor compounds made of metal with low dimension oxygen showed an enormous ability to solve many issues, such as developing sensor systems, producing antibiotics, developing transistors, etc. Oxide compounds are of great importance in terms of the multiplicity of scientific fields involved in their development. The researchers were interested in developing them and producing new oxide materials or developing discoveries from them through conducting various vaccinations. Metal oxides are very important in the manufacture of materials needed for development in various scientific fields of. Studies focused on investigating the different properties of oxide compounds prepared using different methods, such as microwave deposition, self-building, etc. Previous studies focusing on the oxide mixture (NiO/CdO) as well as other metal oxides have achieved significant success in many applications in both the technological and biological fields [1].
The nickel nanoparticle oxide is a pale green solid nanoparticle oxide that dissolves in solutions and alcohol of type P and has a cube crystalline structure (1-6b), possessing a high-energy gap of (3.5eV-4 eV) [2]. Nickel oxides and their atoms have been studied extensively in the past few years, and have shown to possess high electrical conductivity and ferromagnetic properties at high temperatures [3]. High electrical conductivity and has potential applications on display, optical devices and other applications. Polyvinyl Alcohol (PVA) is of interest because of its simple processing, high transmittance and easily soluble in water so it has numerous applications in polymer engineering technology, pharmaceutical and biomedical applications [4].
The study claimed the enhanced thermal stability of PVA/nanocomposites as compared to the pure PVA is the most widely reported technique. Beads free PVA based CdO nanofibers were synthesized by electrospinning technique [5]. In general, PVA is most-widely used polymer for various precursor salt due to its good water solubility nature, hydrophilic nature of PVA polymer gives excellent chemical and thermal stability with different metal salts [6, 7]. Furthermore, PVA also exhibits semicrystalline, which is a good sign for synthesizing crystalline nanofibers [8].
Experimental Details
Materials
The starting chemicals of Polyvinyl Alcohol (PVA) (Sigma-Aldrich, 98%). Distilled water (Yamco,99%) was used as solvent throughout this study. Polyvinyl Alcohol (PVA) with MW=72000, was dissolved completely under constant stirring. Nickle nitrate ([Ni (NO3 )2 .4H2 O] (Sigma-Aldrich,98%) with MW=290.81. Cadmium nitrate ([Cd (NO3 ) 2.4H2 O] (Sigma-Aldrich,98%) with MW=308.47
Synthesis of (NiO/CdO) nanocomposite
Polymer (PVA) (5 g) was dissolved in 500 ml of distilled water at a temperature of 80 C for 8 hours. The following relation was used to calculate the required weights.

In which W denotes weight, M is molarity, V is solvent volume, and Mwt is molecular weight. The dissolved polymer was divided into five with a fixed volume of 40 ml per baker. The double addition of aqueous nickel nitrate and aqueous cadmium nitrate was carried out in two steps.
The nitrate solutions were prepared separately by dissolving them in a fixed volume of distilled water (10 ml with different molar concentrations). Then, a fixed volume of polyvinyl alcohol (PVA) (40 ml) was double mixed with the prepared solutions, shown in the previous table of cadmium nitrate and aqueous nickel nitrate for the five samples with constant stirring at a constant temperature of 40 C for 20 minutes, after which these samples were dried and poured in the dishes of Petri Dash. After that, it was inserted into the drying oven at a temperature of 70 C for a period of 5 hours to obtain a compound ([Cd (NO3 ) 2.4H2 O] \ PVA \ [Ni (NO3 ) 2.6H2 O]) as flexible transparent disks. The Model LDO-080N CERTIFIED, a drying oven of the Faculty of Applied Sciences (Thamar University, Yemen), was used to dry the prepared samples, heating the prepared samples to the required temperature to get rid of the water and obtain solid samples within a short period of time. Finally, the prepared samples were platelimb at a temperature of 500 C to obtain the nanoxide mixture(NiO/CdO) from the prepared samples with their different concentrations.
Results and Discussion
X-ray Diffraction (XRD)
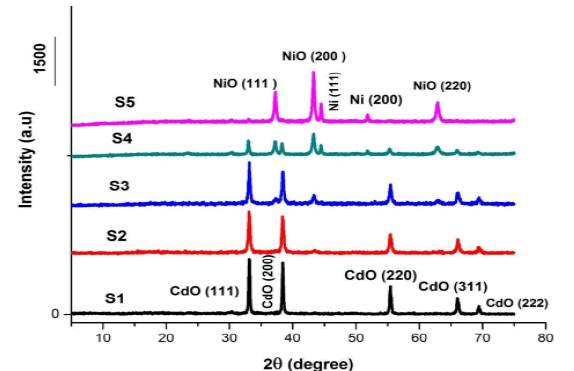
That have been prepared, and through which can know the crystal structure of the different elements and compounds Figure 1 shows clear reflections of X-ray diffraction for cadmium oxide and nickel oxide in the samples (S1), (S2), (S3), (S4), (S5) prepared in a fixed volume of polyvinyl alcohol at 5 concentrations. Molarity is different [(1:0),(3:1),(1:1),(1:3),(0:1)].
Figure 1 showed diffraction patterns for the samples (S1), (S2), (S3), (S4) at the crystalline levels (111),(200), (220), (311) and (222) for the corresponding angles (2θ), respectively (33), (38.3), (55.5), (66.2), and (69.56) this indicates the presence of Cadmium (CdO) with a cubic structure that exactly matches the card (JCPDS) No. (0.5- 064) and confirms that the (CdO) sample is a Face Centered Cubic (FCC) structure [9].
Figure 1 also showed diffraction patterns for the samples (S2), (S3), (S4), (S5) at the crystalline levels (111), (200) and (220) for the corresponding angles (2θ), respectively (37.2), (43.2) and (62.98). This indicates the presence of nickel oxide (NiO) with a cubic structure that is in perfect conformity with the card (JCPDS) No. (47-1049), which confirms that the NiO sample is a cube crystal structure.
In Figure 1, we notice the appearance of diffraction patterns of the transition element (Ni) in the samples (S4) and (S5), due to the high percentage of nickel nitrate in the two samples during preparation.
To calculate the reticular constant (ahkl ) in Table 1 of Cadmium Oxide and Table 2 of Nickel Oxide,the following relation was used.
TABLE 1 XRD Calculations of cadmium oxide for Prepared Samples
| Samples | Planes | Average Of Lattice Constant (a) A | Specific Surface Area (SSA) (m2/g) | Grain Size (t) (nm | Morphology Index (MI) Rad | Dislocation density ) δ*1015) (1/m2 ) | XRDtheoretical density (ρm) (g/cm3 ) |
|---|---|---|---|---|---|---|---|
| S1 | Plane(111) | 4.686 | 1783.6 | 34.61 | 0.009 | 0.8 | 16.58 |
| Plane(200) | 0.009 | ||||||
| Plane(220) | 0.008 | ||||||
| Plane(311) | 0.008 | ||||||
| Plane(222) | 0.008 | ||||||
| S2 | Plane(111) | 4.6857 | 1783.3 | 27.75 | 0.008 | 1.3 | 16.58 |
| Plane(200) | 0.008 | ||||||
| Plane(220) | 0.007 | ||||||
| Plane(311) | 0.007 | ||||||
| Plane(222) | 0.007 | ||||||
| S3 | Plane(111) | 4.6855 | 1783.4 | 28.57 | 0.008 | 1.2 | 16.58 |
| Plane(200) | 0.008 | ||||||
| Plane(220) | 0.007 | ||||||
| Plane(311) | 0.007 | ||||||
| Plane(222) | 0.007 | ||||||
| S4 | Plane(111) | 4.6912 | 1787.6 | 34.73 | 0.008 | 0.9 | 16.52 |
| Plane(200) | 0.009 | ||||||
| Plane(220) | 0.008 | ||||||
| Plane(311) | 0.008 | ||||||
| Plane(222) | 0.008 |
TABLE 2 XRD Calculations of Nickel Oxide for Prepared Samples
| Samples | Planes | Average Of Lattice Constant (a) A | Specific Surface Area (SSA) (m2/g) | Grain Size (t) (nm | Morphology Index (MI) Rad | Dislocation density ) δ*1015) (1/m2 ) | XRDtheoretical density (ρm) ( g/cm3 ) |
|---|---|---|---|---|---|---|---|
| S1 | Plane(111) | 3.3528 | 1569.8 | 13.21 | 0.007 | 5.7 | 26.33 |
| Plane(200) | 0.007 | ||||||
| Plane(220) | 0.007 | ||||||
| S2 | Plane(111) | 3.3603 | 1576.9 | 14.6 | 0.007 | 4.7 | 26.15 |
| Plane(200) | 0.007 | ||||||
| Plane(220) | 0.007 | ||||||
| S3 | Plane(111) | 3.3651 | 1581.3 | 52.74 | 0.00858 | 0.4 | 26.04 |
| Plane(200) | 0.008 | ||||||
| Plane(220) | 0.007 | ||||||
| S4 | Plane(111) | 3.3643 | 1580.6 | 39.59 | 0.009 | 0.6 | 26.06 |
| Plane(200) | 0.009 | ||||||
| Plane(220) | 0.008 |

In which (ahkl ) denotes the Miller coefficients for crystalline levels, (dhkl ) the distance between the crystalline levels.
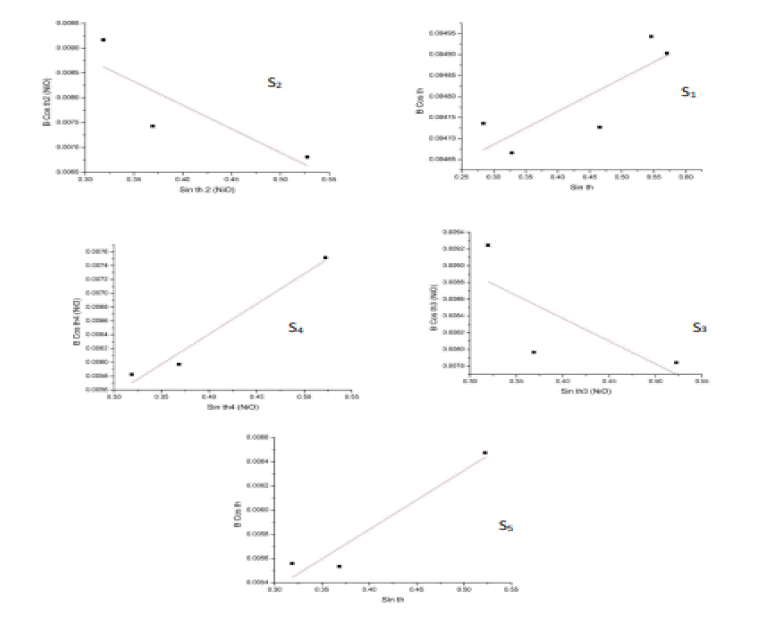
The Hall Equation was used to calculate the grain size of the samples under study.

A graph is drawn between (β Cosθ) on the y axis and (Sinθ) on the x axis. Then, (Origin lab8) application was used to find the best straight line that passes through most points using the (Lineor fitting) command so that we can find the point that the straight line crosses in the axis (y) through the equation (3). Then, this point is given by the value y=λ / t. By knowing the point, the granular size (t) can be calculated as shown in Table 1 and Table 2.The Sample Surface Area (SSA) of nickel oxide in Table 1 and cadmium oxide in Table 2 was calculated using the following relation [10].

In which Mwt denotes the molecular weight of cadmium oxide (Mwt = 128.41 g/mol), and nickel oxide (Mwt = 74.6928 g/mol), a reticular constant, NA is the number of Avogadro (6.022 * 1023). The samples were also calculated by the dislocation density of cadmium oxide in Table 1 and nickel oxide in Table 2 through the relation [11].

In which t denotes the grain size. The morphology index of Oxides has also been calculated in Table 1 and Table 2 by the following relation.

In which FWHMh β is the highest value of the diffraction pattern width at half the value of the maximum intensity; FWHMp β the angle value of the diffraction pattern width at half of the maximum intensity value per pic. Tables 1 and 2 show the XRD-theoretical density values that were found using the following relation [12].

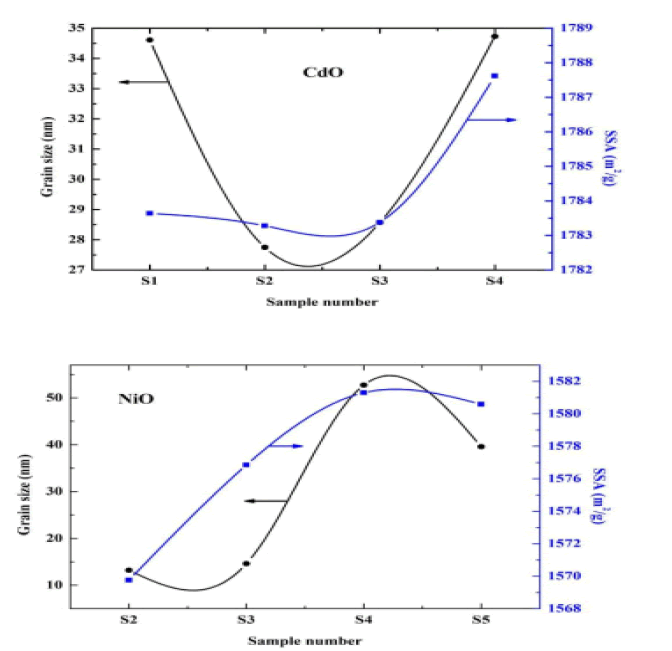
Through the results in the above table, the morphology of the surface, the intensity of the dislocation, and the specific surface area were calculated. We noted that the qualitative surface area increased mostly with increasing granular size and decreased with decreasing granular size. In contrast, the ratio of the surface area to volume would increase with the decrease in the granular volume in both oxides, and the intensity of the eruptions decreased with the increase in the surface area of the surface and increased with the decrease in the surface qualitative area of the surface [13]. The value of the grid constant is consistent with previous studies. It was also found that the severity of the dislocation decreases as the granular size increases and increases with decreasing granular size [14] (Figure 2).
Figure 2:Hall’s law for calculating the grain size
The figure below shows the relation between the SSA and the granular size on the vertical axis relative to the samples on the horizontal axis as in the Figure 3.
Optical properties
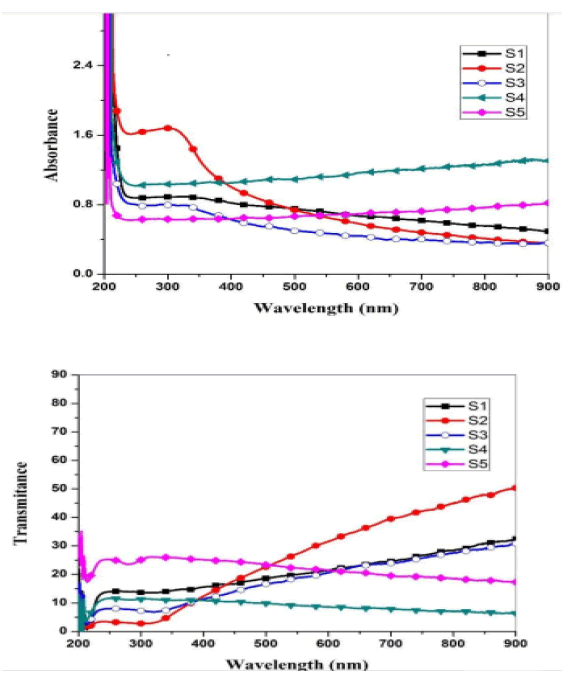
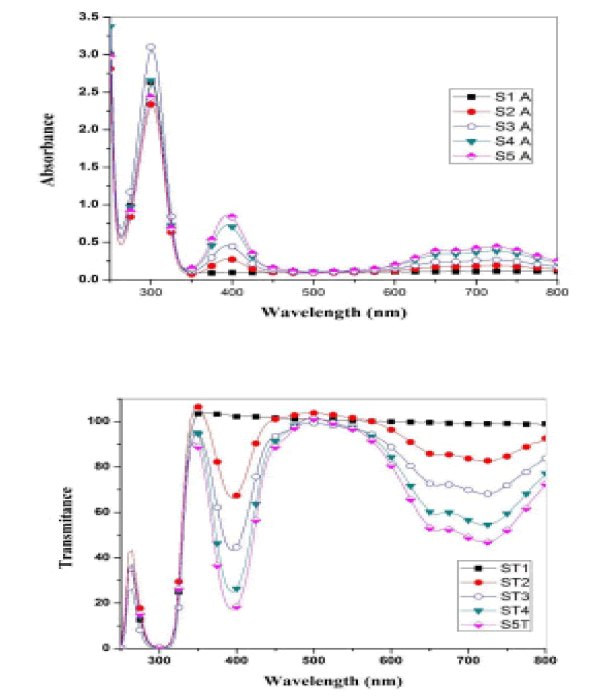
Optical measurements of the oxide samples produced after drying and cracking have been performed at a temperature of 500 C, where absorption spectra of (CdO), (NiO) and (CdO / NiO) are indicated as shown in Figures 4 and 5. The absorption and permeability spectra at wavelengths (215 nm) indicate within the ultraviolet range (190nm-380 nm). Therefore, oxide compounds can be used as a UV protector with lengths less than (215 nm) because the compounds have the ability to absorb them and do not allow their passage.
When a nano-semiconductor (CdO) is formed, the electrons of the (CdO) move from the valence band into the conduction band i.e. from [(4d10) of (Cd) or from (2P6) of (O)] to the conduction band [15].
In the same way for (NiO), electrons move from [(3d8) of (Ni) or from (2P6) of (O)] to the conduction band and thus absorb as a result of the transmission of electrons between energy levels occurs. Whenever the number of electrons large the absorption is higher. The energy gap for direct transmission was calculated by the relation.

In which Eg denotes the energy gap for direct transmission, c is constant depends on the type of semiconductor, ∝ is absorption coefficient and given by the following relation.

In which Absorbance of samples, d is cell thickness equals (1 cm), hv is the photon energy and can be calculated from the following relation.

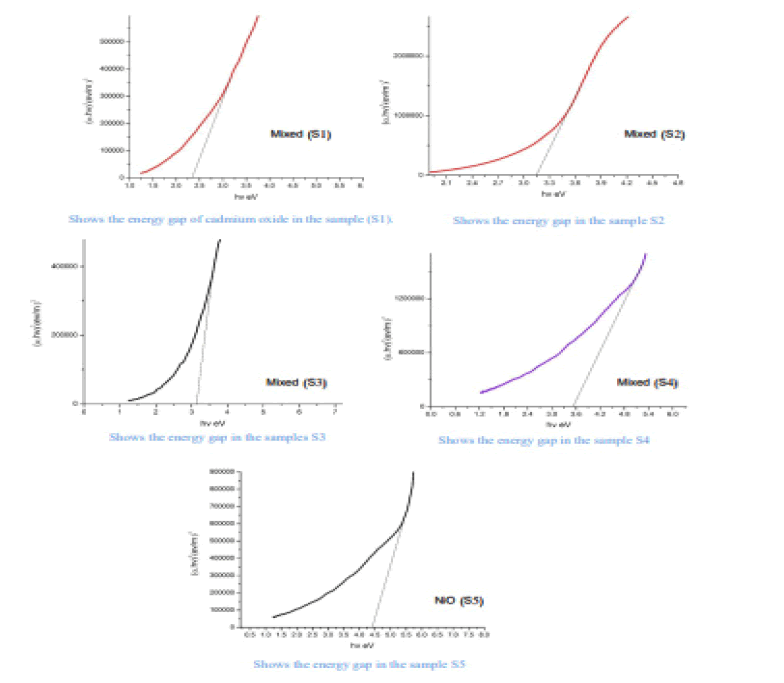
Where the absorbance coefficient was calculated for all absorbance values (A), and the photon energy was calculated from the relationship (10) for all wavelengths (λ) at which the absorbance was measured. The change between the left side of the equation (8) and the photon energy hv results in a curve formation group of points forms a straight line, When taking along these points straightening produces a straight line through the axis of hv value that intersects with this line represents the value of the energy gap Eg for the sample. The energy gap value was calculated for both CdO and NiO and for the mixture and was as shown in the Figure 6.
The Table 3 shows the energy gap for prepared oxides (CdO), (NiO), (CdO / NiO) in samples (S1, S2, S3, S4, S5)
TABLE 3 Energy Gap Calculations
| Energy Gap Values | |||||
|---|---|---|---|---|---|
| Samples | S1 | S2 | S3 | S4 | S5 |
| CdO | 2.4 | - | - | - | - |
| Mixed | - | 3.15 | 3.2 | 3.5 | - |
| NiO | - | - | - | - | 4.4 |
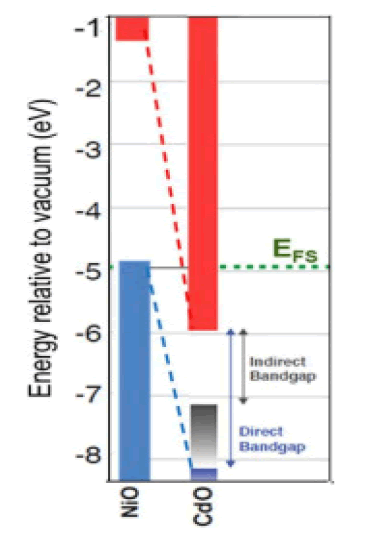
From the above results, we notice an increase in the energy gap of the samples. The increase in the energy gap is due to the discordant interaction between the unfilled states at the lowest edge of the conduction band of the CdO with the highest edge of the valence band of (NiO) which is the donor-like level of (CdO) as a result of mixing. The higher the (NiO) concentration inside the sample, the more electrons are at the d-level. Thus, the repulsion between the electrons of the lowest conduction band of the CdO and electrons of the highest valence band for (NiO) which increases the widening energy gap of the mixture [16]. We also notice an increase in the energy gap of (CdO) and (NiO), and this may be caused by the occurrence of quantitative restriction of samples as shown in Figure 7.
Conclusion
X-ray diffraction showed several results, the most important of which are:
• The presence of diffraction patterns for the transition element (Ni) in the two samples (S4) and (S5), due to the high percentage of nickel nitrate in the two samples during preparation.
• Through calculations, it was found that the specific surface area increases with increasing granular size and decreases with decreasing granular size. On the other hand, the ratio of surface area to volume increased with decrease in granular size, and this is consistent with previous studies.
• It was found through the calculations that the intensity of the eruptions decrease as the granular size increases and increase with decreasing granular size.
The results of the optical properties study showed the following:
• Absorption spectra appeared at the wavelength (215 nm) within the ultraviolet range (190 nm-380 nm). Therefore, oxide compounds can be used as a UV protector with lengths less than (215 nm) because the compounds have the ability to absorb them and do not allow their passage.
• An increase in the value of the energy gap of the mixture with an increase in the concentration (NiO). This is due to the incoherent reaction as a result of mixing. The energy gap for nickel oxide and cadmium oxidehas increased, due to the occurrence of quantitative restriction.
References
- Karthik K., Dhanuskodi S., Gobinath C., et al. Multifunctional properties of cdo nanostructures synthesised through microwave assisted hydrothermal method. Materials research innovations. 2018a:9.
- Bahadur J., Sen D., Mazumder S. et al. Effect of heat treatment on pore structure in nanocrystalline nio: a small angle neutron scattering study. Journal pramana of physics. 2008:71;6.
- Kim G. & Hyun SJ. Effect of mixing on thermal properties of aerogel-pvb composites. Materials science. 2003:38.
- Zhang FM, Chang J & B., e. Dissolution of poly(vinyl alcohol)-modified carbon nanotubes in a buffer solution. New carbon mater. 2010:25;6.
- Lagashetty A., Basavaraj S., Bedre M. et al. Metal oxide dispersed polyvinyl alcohol nanocomposites. Metallmater sci. 2009:51;10.
[Google Scholar] [Crossref]
- Koski A., Yim K. & Shivkumar S. Effect of molecular weight on fibrous pva produced by electrospinning mater. Lett. 2004:58;5.
- Gao Q., Takizawa J. & Kimura M. Hydrophilic non-wovens made of cross-linked fully-hydrolyzed poly (vinyl alcohol) electrospun nanofibers. Polymer.2013:54;7
- Thomas D., Zhuravlev E., Wurm A., et al. Fundamental thermal properties of polyvinyl alcohol by fast scanning calorimetry. Polymer. 2018:137;10.
[Google Scholar] [Crossref]
- Yufanyi DM., Tendo JF., Ondoh M. et al 2014. Cdo nanoparticles by thermal decomposition of a cadmium-hexamethylenetetramine complex. Materials science research. 2014:3(3);11.
- Li SP., Hou., et al. Studies on intrinsic ionization constants of fe–al–mg hydrotalcite-like compounds. Colloid and interface science. 2003:257;6.
- Karthik K., Dhanuskodi S., Gobinath C., et al. Nanostructured cdonio composite for multifunctional applications. Sciencedirect. 2018b:112:13.
- Farooq H., Raza Ahmad M., Jamil Y., et al. Structural, dielectric and magnetic properties of superparamagnetic zinc ferrite nanoparticles synthesized through coprecipitation technique. Kovove mater. 2013:51;6.
[Google Scholar] [Crossref]
- Ghiyasiyan-arani M., Niasari MS., Arani MM. et al. An easy sonochemical route for synthesis, characterization and photocatalytic performance of nanosized fevo4 in the presence of aminoacids as green capping agents. Mater sci: mater electron. 2017:12.
- Karthik K., Dhanuskodi S., Gobinath C. et al. Multifunctional properties of microwave assisted cdo–nio–zno mixed metal oxide nanocomposite: enhanced photocatalytic and antibacterial activities. Materials science. 2017:13.
- Zhang J. Room temperature ferromagnetism of ni-doped sno2 system. Modern applied science. 2010:4;6.
[Google Scholar] [Crossref]
- Francis CA., Detert DM., Cheng., et al. Nixcd1-xo: semiconducting alloys with extreme type iii band offsets. Applied physics letters. 2015:4.


