
A facile composite-hydroxide-mediated route for preparation of composite Fe3+-NiO nanostructures
2 National Institute of Lasers and Optronics (NILOP), Islamabad, Pakistan, Email: tajakashne@gmail.com
3 School of Physics, Trinity College Dublin (TCD), Ireland, Email: tajakashne@gmail.com
4 Chemistry Department, University of Peshawar, Peshawar 45000, Pakistan, Email: bibi@uop.edu.pk
5 FOCAS, Dublin Institute of Technology (DIT), Dublin 8, Ireland, Email: bibi@uop.edu.pk
6 Energy Production and Infrastructure Center, Department of Electrical and Computer Engineering, University of North Carolina at Charlotte, Charlotte, NC, 28223, USA, Email: babar.h@uncc.edu
7 Intel Corporation, Rio Rancho, NM, USA, Email: babar.h@uncc.edu
Received: 24-Aug-2018 Accepted Date: Sep 12, 2018; Published: 25-Sep-2018
Citation: Arfan M, Shahid T, Taj M Khan, et al. A facile composite-hydroxide-mediated route for preparation of composite Fe3+-NiO nanostructures. Nanotechnology Letters September-2018;2(1):11.
This open-access article is distributed under the terms of the Creative Commons Attribution Non-Commercial License (CC BY-NC) (http://creativecommons.org/licenses/by-nc/4.0/), which permits reuse, distribution and reproduction of the article, provided that the original work is properly cited and the reuse is restricted to noncommercial purposes. For commercial reuse, contact reprints@pulsus.com
Abstract
A viable composite-hydroxide-mediated (CHM) method was used to prepare nickel oxide (NiO) nanostructures. Composites of iron(III)-nickel oxide (Fe3+-NiO) nanostructures were obtained using 5%-15% Fe3+ during the synthesis process. NiO and Fe3+-doped NiO composite formations were monitored via X-ray diffraction, Fourier transform infrared spectroscopy (FTIR), scanning electron microscopy, energy dispersive Xray spectroscopy (EDS), and ultraviolet-visible (UV-Vis) spectroscopy. For the proposed range, pure NiO was obtained with octahedral peculiarities. With increased Fe3+ content, the octahedron feature was transformed into new morphologies; the morphological change was significant, given the short reaction time. EDS confirmed the presence of Ni and O elements, and FTIR resolved a strong signature associated with Ni-O bonding. The bandgap of NiO, estimated from UV-Vis measurements, was in the range 1.73-5.68 eV, depending on the Fe3+ doping concentration. For the proposed processing temperature and reaction time, the CHM method shows great potential as an easy nanomaterial preparation procedure for research purposes.
Keywords
CHM; Composites; NiO nanomaterial; SEM; UV-visible spectroscopy
Introduction
Compared to their bulk counterparts, nanomaterial’s exhibit remarkable properties due to their small size and surface effects [1,2]. Over the past few decades, nanomaterial’s have received much attention and occupy a principal position in the expanding nanotechnology industry. To meet industry requirements, significant efforts have been made to reduce material size while retaining the essential properties of material components. In general, these efforts have been fruitful. Among the various nanostructures, transition metal oxides (TMOs) are commonly used in the fabrication of reduced-size electronic devices [3].
The nickel oxide (NiO) nanostructure is of particular interest due to its superior chemical and thermal properties [4]. Additionally, NiO shows the least amount of non-stoichiometry in its bunsenite form Ni1−xO (x<0.001) [5]. However, introduction of dopants such as iron (Fe) creates defect formations within the NiO structure.
NiO has attracted widespread attention due to its diverse range of applications, e.g., in catalysis, battery cathodes, gas sensors, electrochromic films, and magnetic materials [6-12]. It is a p-type semiconductor, with a wide bandgap and cubic lattice structure. The nanoscale structures of NiO have been synthesized for use in numerous research fields, with increasing demand for improved properties. As such, various methods have been used to fabricate NiO nanostructures, including thermal decomposition, sol-gel, microwave pyrolysis, solvothermal, anodic arc plasma, sonochemical, precipitation-calcination, and microemulsion techniques [13-20], with the aim of improving the properties of NiO.
All of these approaches are important, in that the structural and morphological properties of NiO depend on the synthesis method [21]. Apart from the aforementioned methods, NiO can be prepared using a low-cost composite-hydroxide-mediated (CHM) route, as demonstrated in the preparation of several materials by our research group [22-25]; more recently, this methodology was used to create attractive pyramid-shaped nanostructures [26].
In the present study, we investigated the potential of using the CHM method to produce Fe3+-NiO nanostructured composites and the resulting physical properties of the as-prepared composites. Researchers have used different synthesis methodologies to improve the structural, chemical, thermal, electronic, and mechanical properties of NiO by doping it with different metals such as lithium (Li), copper (Cu), potassium (K), Fe, and aluminum (Al) to meet the requirements of an expanding industry [27-33].
Several groups have reported on Fe-containing magnetic nanoparticles for various applications [34-42]. Among the above synthesis methods, the CHM method has the advantages of simplicity, versatility, and costeffectiveness. For example, the method can be used to produce multifold nanomaterials and their associated composites.
Due to the slow reaction rate, the growth kinetics can be controlled to finetune the size and morphology of the nano-fabricated product. Additionally, this method uses inexpensive molten hydroxide materials, in which the main source materials are incorporated at the eutectic point and at atmospheric pressure. This allows melting and reaction of source materials to occur at much lower temperatures.
Furthermore, the CHM method does not require sophisticated instrumentation, a vacuum environment, or the use of capping reagents, as clean surfaces can be produced by controlling the reaction temperature and time, which can easily be functionalized for different applications [4-10]. The production yield is typically higher compared to other chemical methods. As such, the method has been applied successfully to the synthesis of nanomaterials to control size and morphology, with effective incorporation of various metals for composite nanostructure preparation [43-47].
In this paper, we report on using the CHM method to fabricate NiO nanostructures; we examined the morphological, structural, and optical changes that occurred with Fe3+ incorporation to create Fe3+-NiO composites. The method provided a pure NiO product, up to 15% Fe3+ content. The solubility and chemical reactions of the reactants were sufficient for melting, dissolution, and reaction, given the proposed Fe3+ content range, at the anticipated temperature and required processing time for NiO composite nanostructure formation. We further examined how to tune the bandgap of NiO via varying the Fe3+ doping concentration.
Materials and Methods
Synthesis of NiO nanomaterial
Pure and Fe3+-doped NiO octahedral nanostructures were prepared using the CHM approach which is described in our early reports [22-25]. The starting materials were of analytical grade (Merk Company) and were used as received without further purification. We used 20 g of NaOH and KOH melts in the ratio 51.5: 48.5. Melts were mixed together and placed in a 25 mL Teflon beaker with an appropriate amount of Ni(NO3)2.6H2O for pure NiO.
The Teflon beaker and all of the reagents were placed in a pre-heated furnace at 200°C for 24 h. After all of the reactants had melted completely, the mixture was shaken well until uniform and then put back in the furnace for a further 24 h. After the heating process, the beaker was removed from the furnace and allowed to cool to room temperature for material crystallization.
The product was washed with distilled water, filtered, and dried. For doping purposes, 5%, 10%, or 15% Fe(NO3)2.6H2O was added under the same conditions, together with the hydroxide mixture and Ni(NO3)2.6H2O.
The reaction mechanism to form NiO nanocrystals is given below:
Ni(NO3)26H2O+2NaOH → Ni(OH)2+2NaNO3+6H2O
Ni2++2OH-→Ni(OH)2
Ni(OH)2 is chemically unstable at high temperatures and splits to form NiO and water molecules.
The precipitated NiO nanocrystals form as follows:
Ni(OH2) → NiO ↓ +H2O
A schematic diagram of NiO nanomaterial formation is shown in Figure 1. The obtained product was used for structural and optical characterization and analysis.

Figure 1) Representative schematic diagram of the compositehydroxide- mediated (CHM) method showing the various steps involved in the preparation of iron(III)-doped nickel oxide (Fe3+-NiO) nanomaterial.
Characterization
X-ray diffraction (XRD) analysis was carried out with a PANalytical Xray diffractometer (PANalytical, Almedo, The Netherlands) using Cu-Kα monochromatic radiation (λ=1.5406 Å); X-rays were produced at 40 kV and 30 mA. A MIRA3 Tescan system (Tescan, Kohoutovice, Czech Republic) equipped with energy dispersive X-ray spectroscopy (EDS) capabilities was used to analyze the morphology and chemical composition of pure and Fe3+-doped NiO.
Fourier transform infrared spectroscopy (FTIR) measurements were conducted using a Perkin Elmer FTIR spectrometer (Perkin Elmer, Waltham, MA, USA) over the spectral range 400-4500 cm−1. Ultravioletvisible (UV-Vis) spectroscopy was performed over the spectral range 200-800 nm; the optical bandgap was estimated from the scanned spectra.
Results and Discussion
XRD analysis
Figure 2 shows the XRD patterns of pure and Fe3+-NiO composites; all patterns exhibited sharp face-centered cubic single-phase NiO peaks that closely matched JCPDS#01-073-1519. Diffraction peaks for the pure sample were well positioned at 2θ=37.42°, 43.43°, 62.95°, 75.95°, and 79.4°, corresponding to the (111), (200), (220), (311), and (222) planes, respectively.
A comparison of the (111) and (200) reflection planes for different Fe3+ contents revealed significant changes that occurred in the full width at half maximum (FWHM) and intensity of the peaks as the dopant content varied. The samples prepared under the same conditions with 5%, 10%, or 15% Fe3+ content showed similar reflection planes, with a small hump evident for NiO samples with 10% Fe3+ content.
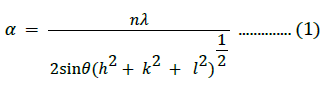
This feature was not visible for the 15% Fe3+-NiO sample; its origin is unclear and requires further investigation, but we suggest that it may be due to the defect structure created in NiO with the incorporation of Fe3+ with a different stoichiometry [5]. Specifically, cation vacancies around the main NiO structure may lead to defect generation. The lattice parameter (a) for the cubic structure is given by:
The cell volume of the prepared cubic NiO nanostructures was estimated as
The X-ray density was calculated using the molecular weight and volume of the unit cell of the samples, as follows [48]:
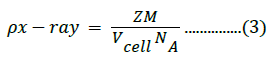
Where z is the number of molecules per formula unit, M is the molar mass, NA is Avogadro’s number, and Vcell is the volume of the unit cell. Structural parameter values are listed in Table 1; the average crystallite size was obtained from XRD measurements. The lattice constants for the composite samples were 4.166, 4.167, and 4.165 Å for samples with 5%, 10%, and 15% Fe3+ content, respectively.
| Iron (III) concentration | a (Å) | V (Å3) | Density (g.cm−3) | Crystallite size (nm) | Bandgap (eV) |
|---|---|---|---|---|---|
| 0% | 4.171 | 72.56 | 6.83 | 73.34 | 5.68 |
| 5% | 4.166 | 72.35 | 6.85 | 64.41 | 2.98 |
| 10% | 4.167 | 72.35 | 6.85 | 42.91 | 3.68 |
| 15% | 4.165 | 72.25 | 6.86 | 35.83 | 1.73 |
| NiO* | 4.1684 | 72.43 | 6.85 | --- | 4 |
*NiO JCPDS# 01-073-1519. ** Bandgap of bulk NiO ~ 4 eV.
Table 1. Structural and optical parameters of composite hydroxide-mediated-prepared Fe3+-NiO calculated by X-ray diffraction and absorption spectroscopy.
These values indicate a decreasing trend as compared to the value of 4.171 Å obtained for pure NiO. The variation in lattice parameters was most likely due to the slight difference in the ionic radii of Ni+2 (0.69 Å) and Fe +3 (0.64 Å) [49].
The calculated lattice constants showed a decreasing tendency, whereas a small increase in X-ray density was observed with increasing Fe3+ content. The replacement of Ni+2 with Fe+3 ions at the octahedral site of face-centered cubic NiO alters the lattice parameters and changes the crystalline structure.
The incorporation of Fe3+ ions creates internal strain and microstructural disorder. The small shift in the diffraction peaks towards higher angles is the result of Fe3+ incorporation in the NiO host material. The grain size of pure and doped samples can be calculated using Scherrer’s formula [50]:
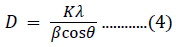
where β denotes the FWHM of the diffraction peak in radian units; K is the correction factor, with a value of 0.9 for the FWHM of the crystals; λ is the Cu-Kα wavelength in units of nm; and θ is the angular position (Bragg’s angle) in radian units. The average crystallite sizes for 5%-, 10%-, and 15%-Fe3+-doped NiO were 64.41, 42.91, and 35.83 nm, respectively. These values were smaller than the value of 73.34 nm for pure NiO.
The reduction in average crystallite size for the 5%- and 10%-doped samples was due to the incorporation of Fe3+ ions in the host lattice of NiO; additionally, this reduction indicates that the host lattice restricted the incorporation of Fe+3 ions.
There was an upshift in the 2θ value for the peak corresponding to the (200) plane for the 15%-doped sample, as well as a higher value for the FWHM, compared with the 5%-doped sample. The variations in the lattice constant (a) and X-ray density (ρ) with doping concentration are displayed in (Figure 2). The smallest value of the FWHM for the peak corresponding to the (200) plane was observed for the 5%-doped sample; the largest value was observed for the 15%-doped sample.

Figure 2) (a) X-ray diffraction pattern of NiO nanomaterial prepared with different Fe3+ concentrations. (b) Variation of the 2θ value for the two planes (111) and (200), showing how the diffraction intensity and 2θ value of these planes change with Fe3+ content. (c) Variation of the lattice constant and X-ray density with different concentrations of Fe3+.
SEM analysis
Figure 3 shows scanning electron microscopy (SEM) images of the morphologies of pure and Ni1−xFexO (x=0%, 5%, 10%, and 15%) nanomaterials. The crystals displayed an octahedral shape with size variation. The anisotropic growth of nano-octahedral structures can be explained in terms of the formation of small nuclei of NiO.

Figure 3) Scanning electron microscopy images of NiO nanostructures prepared at 200°C with a reaction time of 24 h: (a) pure NiO and (b) 5%-, (c) 10%-, and (d) 15% Fe3+-NiO. (e) and (f) Energy dispersive X-ray spectra of pure and 15% Fe3+-NiO, respectively.
Initially, Ni+2 ions and OH−1 ions form Ni(OH)2. Subsequently, the Ni(OH)2 further decomposes into NiO and H2O. In the second step, these small nuclei aggregate to form larger particles, leading to intermediate structure formation.
Finally, continued growth results in nanostructured octahedron formations. Yaohui et al. investigated the force required to assemble particles into an inherent anisotropic structure, as well as the crystal surface reactivity. Growth along the (111) plane leads to the formation of stablehigh-quality octahedron formations [51]. In general, thermodynamics and kinetics are the controlling factors for nanostructure growth.
Thermodynamically controlled structures favor uniform crystal plane growth, which further leads to the development of spherical nanostructures, whereas anisotropic growth is favored by a kinetically controlled mode. Both mechanisms have their importance in defining the nonstructural shape. Still, no one fully understands the formation mechanism of nanostructure morphologies [52].
The morphological changes observed with changes in the dopant concentration are characteristic of the viscosity of the added dopant salt, which causes the nucleation of materials to take on various morphological forms. The formation of these structures depends strongly on the chemical reaction and viscosity of the reacting materials.
In a typical CHM reaction, hydroxides play a role not only as a solvent but also as a means to lower the reactant temperature. The hydroxide viscosity is very high, such that the growth of the NiO nanostructures is somewhat slow; this, in turn, leads to the formation of the observed morphological structures.
The variation in the size of the crystallites was irregular and did not seem to be consistent with the XRD data; we attributed this outcome to the lowmagnification and poor resolution of the SEM machine used. EDS spectra for the elemental identification of the product are shown in Figure 3 for pure NiO and 15%-Fe3+-NiO samples only.
FTIR analysis
FTIR spectra were recorded at room temperature over the spectral range of 400–5000 cm−1, as shown in Figure 4. The spectra of all samples showed a strong, broad vibrational band at 416–440 cm−1, corresponding to Ni-O vibrational bonding, a strong signature regarding the crystallization of pure NiO [16].

Figure 4) Fourier transform infrared spectroscopy (FTIR) spectra of pure and Fe3+-doped (5%, 10%, and 15%) NiO nanostructures prepared at 200°C for a constant reaction of 24 h.
The vibrational band at 2344 cm−1 was due to the presence of CO2 molecules [14]. The band in the sample with 15% Fe3+ showed a low depth of transmittance. There was no evidence in the FTIR spectra of vibrational bands from impurities in the final product, thus confirming the synthesis of a pure NiO nanoproduct using the CHM method.
UV-visible spectroscopy
UV-vis spectroscopy was conducted on pure and Fe3+-doped (5%, 10%, and 15%), NiO samples using a Perkin Elmer spectrometer. The spectra were scanned over the range 200-800 nm, as shown in Figure 5.

Figure 5) (a) Ultraviolet-visible absorption spectra of CHM-prepared pure and doped NiO nanomaterial at 200°C and a constant reaction time (24 h). (b) (αhʋ) 2 vs. hʋ plot of as-prepared NiO. The bandgap, Eg, corresponds to the intercept of the line at the hѵ-axis for the bandgap calculation. (c) Variation in the bandgap energy with Fe3+ content.
Tauc’s relation was used to calculate the energy bandgap of pure and Fe3+- doped NiO, based on the recorded absorbance spectra, as described by the following equation [53]:
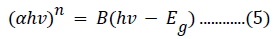
where hν is the photon energy, n has a value of 2 for a direct bandgap semiconductor or 1/2 for an indirect material, B is a material constant, and α is the absorption coefficient. The absorption coefficient is related to the extinction coefficient (k) and wavelength (λ) by the following:
As NiO is a direct bandgap material, n=2 in the above relationship. The extrapolation of the linear portion of the curve (αhν)n- hν to the x-axis, the energy bandgap axis, gives the optical bandgap energy of the absorbance peak, as shown in Figure 5.
The observed bandgap values are listed in Table 1. The bandgap energy calculated for pure nickel oxide was 5.68 eV, which is greater than the reported value. For the Fe3+-doped nanostructures, the energy bandgap values were lower than those of the bulk (Figure 5). The reduction in bandgap energy of the as-prepared Fe3+-doped NiO samples was attributed to the foreign Fe3+ impurity incorporated into the NiO matrix.
Conclusion
In conclusion, the CHM method was used to prepare NiO and Fe3+-doped NiO nanomaterial composites. Formation of a single-phase, high-purity NiO nanomaterial was observed in the proposed dopant range. The average particle size showed a tendency to decrease with increasing Fe3+ content. The reduction in average particle size indicates that the host lattice restricted the incorporation of Fe+3 ions. The octahedral peculiarities changed with the Fe3+ content in the composite structures. Also, a wide range of bandgap energies was achieved, with the ability to tune the bandgap over the range 1.54 to 5.68 eV.
We expect that the synthesis procedure described for pure NiO and Fe3+- doped NiO composites is a suitable and viable approach to produce these composites on a large scale for energy-efficient device fabrication. Additionally, this method can be extended to other composite nanomaterials. For practical application, the CHM method requires further adjustment to achieve fine control over synthesis parameters; highresolution transmission electron microscopy is expected to be beneficial in this regard.
Acknowledgements
Several characterization techniques were used in this research work which is greatly acknowledged. Particularly, we gratefully acknowledge Quaide- Azam University for X-ray differaction (XRD) analysis, National Centre for Physics for providing access to UV-visible spectroscopy, PIEAS for fourier transform unfra-red (FTIR), and ICST for scanning electron microscopy (SEM) and energy-dispersive X-ray spectroscopy (EDS). We are also thankful to Dr. Khalid Almgeer and Irfan Sabir for their appreciable cooperation.
REFERENCES
- Ghobadifard M, Mahmoudi M, Khelghati M, et al. Sonochemical synthesis, characterization, and gas sensing properties of NiO nanoparticles. Nanotechnol Adv Mater. 2015;3:107-14
- Khan Y, Durrani SK, Khan MR, et al. Synthesis Of Transition Metal Oxide Nanocrystals By Cost Effective Hydrothermal Process. The Nucleus. 2009;46:479
- Musevi SJ, Aslani A, Motahari H, et al. Offer a novel method for size appraise of NiO nanoparticles by PL analysis: Synthesis by sonochemical method. J Saudi Chem Soc. 2016;20:3
- Osuwa JC, Onyejiuwa GI. Structural And Electrical Properties Of Annealed Nickel Oxide (NiO) Thin Films Prepared By Chemical Bath Deposition. J Ovon Res. 2013;9:9-15
- Mallick P, Mishra NC. Evolution of Structure, Microstructure, Electrical and Magnetic Properties of Nickel Oxide (NiO) with Transition Metal ion Doping. Am J Mater Sci. 2012;2:66-71
- Alejandre A, Medina F, Salagre P, et al. Preparation and Activity of Cu–Al Mixed Oxides via Hydrotalcite-like Precursors for the Oxidation of Phenol Aqueous Solutions Appl Catal B Environ. 1998:18;307.
- Fan Y, Ma Z, Wang L, et al. In-situ synthesis of NiO foamed sheets on Ni foam as efficient cathode of battery-type supercapacitorElectrochim. Acta. 2018;269:62.
- Hotový I, Huran J, Spiess L. R. Čapkovic and Š. Haščı́k, Preparation and characterization of NiO thin films for gas sensor applications Vac. 2000;58:300.
- Hotovy I, Huran J, Spiess L, et al. Preparation of nickel oxide thin films for gas sensors applications Sens Actuators B: Chem. 1999;147:57
- Lin SH, Chen F, Kai J. Fast-Switching Electrochromic Li-Doped NiO Films by Ultrasonic Spray Deposition Appl Surf Sci. 2017;3:254
- Huang H, Tian J, Zhang WK, et al. Electrochromic properties of porous NiO thin film as a counter electrode for NiO/WO3 complementary electrochromic windowElectrochim. Acta. 2011;4281:56
- Thota S, Kumar J. Sol–gel synthesis and anomalous magnetic behaviour of NiO nanoparticles. J Phys Chem Solids. 2007;68:1951.
- Wang W, Liu Y, Xu C, et al. Synthesis of NiO nanorods by a novel simple precursor thermal decomposition approach. Chem Phys Lett. 2002;362:119.
- Xiang L, Deng XY, Jin Y. Experimental study on synthesis of NiO nano-particles. Scripta Mater. 2002;47:219
- Wang Y, Ke J. Preparation of nickel oxide powder by decomposition of basic nickel carbonate in microwave field with nickel oxide seed as a microwave absorbing additive. Mater Res Bull. 1996;31:55
- Anandan K, Rajendran V. Morphological and size effects of NiO nanoparticles via solvothermal process and their optical propertiesMater. Sci Semicond Process. 2011;14:43.
- Wei Z, Qiao H, Yang H, et al. Preparation and characterization of NiO nanoparticles by anodic arc plasma method. J Alloys Compd. 2009;479:855.
- Mohseni Meybodi S, Hosseini S, Rezaee M. Synthesis of wide band gap nanocrystalline NiO powder via a sonochemical methodUltrason. Sonochem. 2012;19:841.
- Deng XY. Synthesis and size control of NiO nanoparticles by water-in-oil microemulsion Mater. Lett. 2004;58:276.
- Du Y, Wang W, Li X, et al. Preparation of NiO nanoparticles in microemulsion and its gas sensing performanceMater. Lett. 2012;68:168.
- Anandan K, Rajendran V. Structural, optical and magnetic properties of well-dispersed NiO nanoparticles synthesized by CTAB assisted solvothermal process. Nanosci Nanotechnol Int J. 2012;4:24
- Khan TM, Shahid T, Zakria M. Optoelectronic properties and temperature dependent mechanisms of composite-hydroxide-mediated approach for the synthesis of CdO nanomaterials. Electronic Mater Lett. 2015;11:366.
- Khan TM, Zakria M, Shakoor RI, et al. Preparation and physical properties of functional barium carbonate nanostructures by a facile composite-hydroxide-mediated route. Adv Mater Lett. 2015;6:592
- Shahid T, Arfan M, Ahmad W, et al. Synthesis and doping feasibility of composite-hydroxide-mediated approach for the Cu1-xZnxO nanomaterials. Adv Mater Lett. 2016;7:561.
- Shahid T, Arfan M, Zeb A, et al. Preparation and physical properties of functional barium carbonate nanostructures by a facile composite-hydroxide-mediated route. Nanomater Nanotechnol. 2018;8
- Shahid T, Khan TM, Zakria M, et al. Synthesis of pyramid-shaped NiO nanostructures using low-temperature composite-hydroxide-mediated approach. J Mater Sci Eng. 2016;5
- Jang WL, Lu Y, Hwang W, et al. Electrical properties of Li-doped NiO films. J Eur Ceram Soc. 2010;30:503
- Yang Y, Dong Q, Hu X, et al. Electrical properties of Li-doped NiO films. J Power Sources. 1999;79: 256
- Zhao L, Su G, Liu W, et al. Optical and electrochemical properties of Cu-doped NiO films prepared by electrochemical deposition. Appl Surf Sci. 2011;257:3974.
- Yang M, Pu H, Zhou Q, et al. Transparent p-type conducting K-doped NiO films deposited by pulsed plasma deposition. T Solid Films. 2012;520:5884.
- Mishra AK, Bandyopadhyay S, Das D. Structural and magnetic properties of pristine and Fe-doped NiO nanoparticles synthesized by the co-precipitation method Mater. Res Bull. 2012;47:2288
- Wang C, Cui X, Liu J, et al. Structural and magnetic properties of pristine and Fe-doped NiO nanoparticles synthesized by the co-precipitation method. ACS Sens. 2016;1:131.
- Pyatnitskii YI, Bostan AI, Raevskaya LN, et al. Effect of the composition of Mn-, Co-and Ni-containing perovskites on their catalytic properties in the oxidative coupling of methane. Theor Exp Chem. 2005;41;117
- Xi Z, Huang R, Li Z, et al. A piecewise fuzzy proportional integral derivative control for polymerase chain reaction thermal cycling. ACS Appl Mater Interfaces. 2015;7:112-15
- Yang H, Liang W, He N, et al. Chemiluminescent labels released from long spacer armfunctionalized magnetic particles: a novel strategy forultrasensitive and highly selective detection of pathogen infections. ACS Appl Mater Interfaces. 2015;7:774
- Liu M, Hu P, Zhang G, et al. Copy number variation analysis by ligation-dependent PCR based on magnetic nanoparticles and chemiluminescence. Theranostics. 2015;5:71.
- Abbasi Z, Rezayati S, Bagheri M, et al. Preparation of a novel, efficient, and recyclable magnetic catalyst, γ-Fe2O3@HAp-Ag nanoparticles, and a solvent- and halogen-free protocol for the synthesis of coumarin derivatives. Chinese Chem Lett. 2017;28:75.
- Mou X, Ali Z, Li B, et al. Multiple genotyping based on multiplex PCR and microarray. Chinese Chem Lett. 2016;27:1661.
- Li D, Lin C, Zhan S, et al. Magnetic and electro-catalytic properties of a copper complex with 2-(pyridylmethyl) amino-N, N-bis (2-methylene-4, 6-difluorophenol). Chinese Chem Lett. 2017;28:1424.
- Li B, Mou X, Chen Z, et al. The development of a rapid high-quality universal nucleic acid extraction kit based on magnetic separation. Sci China Chem. 2017;60:1602
- Abdullah NH, Shameli K, Abdullah EC, et al. A facile and green synthetic approach toward fabrication of starch-stabilized magnetite nanoparticles. Chinese Chem Lett. 2017;28:1590
- Zhou B, Yang H, Deng Y, et al. Ultrasensitive quantitation of MicroRNAs via magnetic beads-based chemiluminesent assay. Sci China Chem. 2016;59:1051.
- Liu H, Hu C, Wang Z. Composite-hydroxide-mediated approach for the synthesis of nanostructures of complex functional-oxides. Nano Lett. 2006;6:1535.
- Hu CH, Xia CH, Wang F, et al. Synthesis of Mn-doped CeO2 nanorods and their application as humidity sensors. Bull Mater Sci. 2011;34:1033.
- Tan J, Zhang W, Lv Y, et al. Facile preparation of Mn-doped CeO2 Submicrorods by composite-hydroxide-salt-mediated approach and their magnetic property. Mater Res. 2013;16:689.
- Zuo Z, Liu D, Liu J, et al. Electrical and photoluminescent behaviors of La (OH)3 nanobelts doped with Ce3+ and Er3+ Mater. Chem Phys. 2010;123:502.
- Jin H, Huang D, Gao Q. Synthesis of lanthanum zirconium oxide nanomaterials through composite-hydroxide-mediated approach. Mater Res Bull. 2012;47:51
- Mushtaq S, Ismail B, Zeb MA, et al. Low-temperature synthesis and characterization of Sn-doped Sb2S3 thin film for solar cell applications. J Alloys Compd. 2015;632:723.
- Moura KO, Lima RJS, Jesus CBR J,et al. Fe-doped NiO nanoparticles: synthesis, characterization, and magnetic properties. Rev Mex Fis. 2012;58:167.
- Peng WQ, Cong GW, Qu SC, et al. Synthesis of shuttle-like ZnO nanostructures from precursor ZnS nanoparticles Nanotechnol. 2005;16:1469
- Lv Y, Huang K, Zhang W, et al. High‐performance gas‐sensing properties of octahedral NiO crystals prepared via one‐step controllable synthesis route. Cryst Res Technol. 2014;49:109.
- Panikkanvalappil RS, Theruvakkattil SS, Samal AK, et al. Anisotropic nanomaterials: structure, growth, assembly, and functions. Nano Rev. 2011;2:58-83
- Pancove JI. Optical processes in semiconductors, Englewood Cliffs, Prentice Hall, New Jersey (1971).