
Research and analysis of electromagnetic monitoring
2 Socar’s Oil and Gas Research and Design Institute, Baku, Azerbaijan, Email: rehman_piriyev@yahoo.com
Received: 26-Apr-2018 Accepted Date: May 22, 2018; Published: 29-May-2018, DOI: 10.4172/2591-7641.1000014
Citation: Piriyev R. Research and analysis of electromagnetic monitoring. J Environ Geol 2017;2(1): 29-34.
This open-access article is distributed under the terms of the Creative Commons Attribution Non-Commercial License (CC BY-NC) (http://creativecommons.org/licenses/by-nc/4.0/), which permits reuse, distribution and reproduction of the article, provided that the original work is properly cited and the reuse is restricted to noncommercial purposes. For commercial reuse, contact reprints@pulsus.com
Abstract
The article shows the possibility to study the geodynamic processes in two directions simultaneously, with continuous observations of natural electromagnetic fields in the low frequency range by changing the dynamics of geoelectrical sections over time and electromagnetic monitoring of internal processes. This range can be characterized by the existence of linear dependence on the seismic and electromagnetic fields that are generated by the internal processes. On the other hand, magnetoelectric investigations show the geoelectric structure of the Earth at the depth of 10-20 km in terms of studying geodynamic processes in this frequency range, as well as changes in the electromagnetic properties of rocks. The expansion of electromagnetic monitoring research plays an indispensable role in the study of geodynamic processes. The main aim behind the research carried out in this area is to identify future earthquake precursors.
Geodynamic processes in electromagnetic fields are related to the preparation period of earthquakes, and the modern interpretation of the geodynamic processes that take place in the Earth's crust is that these processes can be observed by following natural or artificial electromagnetic fields on the Earth's surface. Electromagnetic monitoring of geodynamic processes can be carried out on the basis of two completely different physical processes. One of these is the change of electromagnetic properties of the geological environment due to the tectonic processes, and secondly, the transformation of the mechano-electric energy into the electromagnetic fields on the preparation of earthquakes. They definitely match the first and second type seismic-electric effects [1,2]. On this basis we can say that the geodynamic processes, especially in the formation of an earthquake, are accompanied by active cracking processes and it transforms the special electrical resistance of mountain massives surrounded by tectonic processes as a result of the redistribution of water rocks that saturate the rocks with the sharp change in the porosity of rocks. The relative value of the specific electrical resistance of rocks may be ten or sometimes, thousands times higher than the relative fluctuations of their deformities, depending on the degree of saturation of the structure and other factors [3]. Changes in electrical conductivity also lead to dehydration of rocks, generally in the physical and chemical conditions accompanied by the effects of geodynamic processes, that is evaporation of water solutions occur. Such physical-geological processes change not only the value of electrical conductivity, but also the polarization of the object.
Materials and Methods
Low frequency magnetotelluric monitoring in the northern Tien Shan
The article presents the experimental results of uninterrupted observations of five components of the magnetotelluric field, which started earlier in 1992, at the Bishkek prediction polygon of the High Temperatures Institute of the Kyrgyzstan Academy of Sciences. Measurements were performed at the one of stationary observation posts by the help of a modified automated digital measuring station. Magnetic field measurement was performed by the magnetostatic device. The two electric lines, which are 100 m in length and are driven by the "Travers" system with nonpolar electrodes, were used in North (Ey) and East (Ex) directions as components of the electric field. Disaggregation of data over time is equal to 10 seconds. Digital filtering is divided into two lanes: high speed with a maximum cycle of 1 hour and low speeds of more than 1 hour.
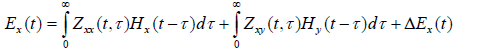
It was proposed an adaptive processing algorithm of the observed magnetotelluric data. This allows the separation of the transmission function (Zxx(t,τ) and Zxy(t, τ) characterizing the sequence of any process occurring in the geological environment, as a combination of generic fields of generations based on random processes (signals). Its basis is the connection between the changes in the magnetotelluric field components at the observation point on the Earth's surface and it is written as a complex integral equation:
 (1)
(1)
Here, the (Zxx(t,τ) and Zxy(t, τ) consider the possibility of switching functions in the time zone to change the field emaciation beyond the boundary requirements and also to the geoelectric curve variation, ΔEx(t) describes other electromagnetic fields. There is a similar (analogous) form in the equation for the expression Hz (t). By the help of this algorithm, regime observations data was obtained in the periodic table of up to one hour in 1993.
Electromagnetic monitoring in a wide frequency range in the Tien Shan seismic zone
The works of the Scientific Station of the Kyrgyzstan Academy of Sciences [4,5] showed that the observed changes in electrical resistance are not usually related to the processes occurring in the future hypocenter and it reflects the elastic-plastic deformation process of the geological environment in the studied area. The seismic process at the local seismic zone is an integral part of the seismic process in the Central Asian region. It is also noted that the distribution of hypocenters of the seismic events in the concrete seismic zone is determined by the depth structure of the area, the presence of easily separated horizons by the help of in seismic observations and depth electromagnetic sounding [6-9]. They are often represented as layers and horizons with low rates of seismic velocities coupled with horizons.
In the Bishkek geodynamic polygon, which is a part of the Northern Tien Shan seismic zone, the regular testing was performed with the use of a field- based method for the use of strong arrays in the depth range up to 25 km from 1984 [10]. As a result, the distribution of anomalous changes zones of resistance in the Earth's crust before the local earthquakes in the studied area. In this case, the maximum change in resistance due to the individual observation amplitude brings to the stronger earthquakes [11,12], and there is no variation of electrical resistance in other stations. There was a result that the contrast of the change of the electrical resistance in the deep horizons of the Earth's crust is maximum, and it is conditioned by the fact that stress deformation processes in the horizons occur more intensely, i.e., the source of these processes should be sought in the lower parts of the Earth's crust.
As a result of field experiments on electromagnetic monitoring of the Northern Tien Shan seismoactive zones, it has created database the magnetotelluric field determined during the measurement, as well as the corresponding parameters of the seismic activity of the studied region (e.g. magnitude of seismic event, a distance from earthquake epicenter) by the help of large lane Phoenix MTU-5. The full database used for researches has been formed from 2004 to 2006, by the help of the catalogue of seismic events and the transformation of the magnetotelluric field measured at the Aksu station. The search for correlation connections between the seismic activity of the KNET catalogue and the transformations of the magnetic field in the Aksu monitoring station was carried out by the help of the neuronal network approach, i.e., the method of counteracting the error (errors) based on the multi-level perseptron [13,14].
Electromagnetic monitoring in Kamchatka Peninsula
The article presents the results of the geomagnetic field variation monitoring in Kamchatka Peninsula [15]. “Paratunka” observatory observes geomagnetic field in the form of H, D, Z components over the last decades. Recently, these components are recorded with 1 sec discretion by the help of a digital geomagnetic station. With this experimental data, the parameters of the Parkinson's induction matrix, the induction vectors between the vertical and horizontal composed parts of the geomagnetic field and the coherence ratios were calculated. Induction matrices in a wide range of period were obtained as a result of continuous geomagnetic surveys during the period 2001-2003. The behavior of the investigated components is determined by the multicolor and vertical geoelectric discrepancy of the environment. It can be judged by using the form of polyar magnetic diagrams on the nature of their effects on different frequencies. The shape and direction of the polar diagram in short-term dipasone is likely to be due to the geoelectric displacement associated with the complex shape of the coastline, and in the long term, the diagrams extend in the direction of the Deep Kuril-Kamchatsky gutter, which is described as a two-dimensional geoelectric uncertainty.
Let's take a closer look at the analysis of the results of the researches conducted on the Upper Paratunka and Tundrovaya observatories.
We know that the study of geodynamic processes using the telluric currents are widely used in Greece, China, the United States, and other countries [16-18]. Geodynamic stress zones are being studied on the basis of different frequencies and intensity of the induced current in the Earth, using the change of natural electromagnetic fields variations in Russia and Azerbaijan. In Russia there are extensive studies in defining the earthquake precursors based on the anomalies of the telluric field. The difficulty is in the nature and separation of anomalies. In some cases, these anomalies may be used to predicting earthquakes.
This part of the article investigates the results of the researches conducted
in Kamchatka, Russia's seismic active region. The bay shaped and hearttype
variations of electro telluric field in the middle and lower latitudes can
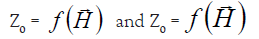
be approximated with the plane wave. In other words, the two models of research can be searched on the Earth's surface as 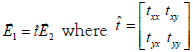 are the complex particles of telluric tensor.
The result of investigations with different equipment’s in Upper Paratunka and Tundrovaya has been analyzed for studying telluric tensor.
 (2)
(2)
 (3)
(3)
It should be pointed out that the main difference between a telluric-current method and a magneto telluric method is that it is impossible to determine the period of vibration in this method, which does not allow the depth of anomalies to be determined, which is to determine the effective depth of the electromagnetic field. In addition, in order to obtain the full range of realtime research, the authors combined a magnetotelluric sounding method with a telluric-current method [15,19,20].
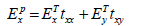
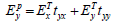
In order to weaken the amplitude of high-frequency vibrations, the authors measured the length of the dipoles in Upper Paratunka at 70 m and 100 m and in Tundrovaya at 97 m and 105 m. The acceptable arrays have discrete prices with one minute interval. The number of such arrays has dropped to 58 for each channel. The linear equations system has been solved by the smallest squares method to determine the particles of the telluric tensor:
The mark for turned out in the 15-day time frame. Two strong earthquakes occurred during a period of registration of electrotelluric fields (from 01.07.1997 to 31.10.1999). The strong earthquakes in Kamchatka Peninsula are characterized by M = 7.7 and M = 6.9. Figure 1 shows the epicenters of these earthquakes. Frequency curves of telluric tensor are shown in Figure 2, the time of occurrence of earthquakes in Figure 3.

Figure 1: Epicenter of strong earthquakes and electro-telluric observation posts in Kamchatka Peninsula

Figure 2: Frequency curves of telluric tensor: 1, 2, 3, 4, 5 – are accordingly matrixes of the telluric field

Figure 3: The graph of Tmax – telluric parameter for 3460 sec
It is clearly shown from the graph of change tmax (tyy) - parameters in the 150° direction that at the time of occurrence of earthquake a particle of the telluric tensor in the direction of yy is characterized by a minimum mark. After the earthquake occurs, the part of the tensor returns to its previous mark. Interestingly, it is clear from the Figure 4 that there is a certain linear connection between the power of the earthquake and the minimum mark.

Figure 4: Old modification of 2500- second impedance module and phase change
To understand information from the tmax parameter of the electrotelluric field about the electrical conductivity of the environment, let's take a look at which part of the MTS curves correspond to 3460 seconds. Studies show that the 3460-second vibration coincides with the lower flank of the MTS tracer characterizing the asthenosphere layer [5,13,21,22]. However, it cannot be said at the same time that it is possible to know the degree of change of the surface of the asthenosphere.
The solution to this problem can be obtained by analyzing individual MTS curves developed in the Upper Paratunka and Tundrovaya fields. The analysis shows that theoretical impedance diagrams based on the main impedances are oval shaped, and the diagrams of additional impedances are reminiscent of a four-petal flower. More precisely, the MTS curves in the Tundrovaya post present that the environment is two-dimensional at low frequencies. The impedance diagrams created on the MTS curves taken at the Paratunka post are more complicated. However, the impedance polyar diagram, which is also taken at this post, indicates that the environment is two-dimensional at low frequencies. The mark of anomaly here is very high and reaches up to 20 units.
Analysis of MTS curves aimed along the main directions of the impedance tensor, that's the extension of Kamchatka Peninsula and perpendicular to them, showed that these are affected by anomalies. The authors note that the direction of the large axis of the impedance diagrams taken at both observations points being perpendicular to the extension of Kamchatka Peninsula has a connection with "coastal effect" [10]. Since the horizontal magnetic field is less exposed to geoelectric anomalies, they are exposed to electrothermic particles, which are almost anomalies. So you need to look for basic information in a telluric field. Let's clarify the nature of anomalies related to earthquakes, based on [19,23], without talking about local and regional geoelectric anomalies.
Based on the connection of minimums with the earthquakes that are given in Figure 3, the tmax parameter varies with the dynamic variations in the Earth's crust. There is such an idea that strong earthquakes occur in large-scale lithosphere plates [23]. Because of the tectonic stress causing the deformation of the geological environment, there is a change in the mineralization level of the water that fills the pores and the pores of rocks, causing anomalous changes in the telluric field.
Graphical data given in Figure 4, shows that the impedance module is more volatile than its phase (13). In the following graph strong earthquakes are characterized by maximum and minimum. At this time the marks of phase change graph over time are almost constant.
As a result of investigations carried out by Abdullayev and Novruzov, it was revealed that the effects of:
 (6)
(6)
Anomalies were evaluated more correctly when they sought the impedance as a function of the magneto telluric field forming it [24]. The effects on the Upper Paratunka and Tundrovaya areas are different depending on the geological structure of those sites.
The question is why is the cost of tmax minimal? The authors regard this event as a special occasion. However, it should be noted that the investigations carried out by the Azerbaijani geophysicists in the Fatmayi polygon showed that, before time, after time and at the time of occurrence of earthquake, a direction of the impedance diagrams is changing [25-29]. Even a direction of the magnetic vector's hodograph turns to the epicenter of the earthquake 100-110 hours before the time of occurrence of earthquake. It turns out that although geodynamic processes do not form a new structure in a relatively little time, because of the chemical composition of the water in the pores of rocks, which causes a change of the structure of porosity, the mark of the impedance as the function of electromagnetic field can change before the time of occurrence of earthquake and after the time of occurrence of earthquake. It is possible to agree with the idea of the authors that the effect is a seismic activity.
Investigations conducted at the Paratunka observatory are characterized by the measurement of H, D and Z particles. These studies cover the years 1990-2000 [14,15]. In recent years, the application of the digital geomagnetic station has allowed the vibrations to be recorded in a range of 1 sec. The record of the H, D, Z particles allowed to obtain the calculation of the transitional functions between the Z and H, D particles in the form of a Visa-Parkinson induction matrix [1], that is,
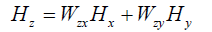 (4)
(4)
The induction vector can be determined on the basis of the induction matrix [1,30,31].
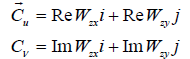 (5)
(5)
When calculating induction vectors, firstly the coherently of vertical and horizontal particles should be taken notice. Thus, the mark of the error for the coherent mark of 0.8 is only a few percent. Processing of materials was carried out on the basis of robust processing method developed by Larsen [31,32].
Issues related to the relationship between the induction vector and the earthquakes have also been considered. In the Paratunka Observatory, the time series of the induction vector were compared at different episodes of strong earthquakes at K ≥ 13 at epicentral distances up to 150 km. As an example, earthquake moments have been selected for T = 6000 and 3000 sec, where annual variations are better represented. As a result of the analysis, it was not possible to detect the effects connected to earthquakes. This is conditioned by the fact that there was no stronger earthquake than K = 14.1 in Kamchatka Peninsula during the reviewed period.
Influence of the moon – the sun high tide deformations to the fluid regime and electric conductivity of the earth's crust in Kola Peninsula
Under the guidance of Camaladdinov, researchers have experimentally investigated the effect of high tide deformation of the Moon-the Sun on the electric conductivity of the Earth's crust in the south-western part of the Kola Peninsula. It should be noted that the change of electric conductivity caused by the well-studied deformation processes is of great importance. One of them is the Earth's high solid tide to assess the sensitivity of the monitoring system to the stress-deformation state of the geological environment. The electromagnetic monitoring experiment was performed by the help of a powerful low frequency radar source called “Zevs” in the condition that the useful signal was over-reaching the obstacle.
Analysis of investigation of the strong Guam earthquake
The article analyzed the use of different analytical methods of signals according to Ultra Low Frequency (ULF) data to study the Guam earthquake [33,34]. The non-genetic material deformed by the geological environment is characterized by the origin and combination of micro-crack immediately before disintegration. Two physical phenomena, which reflected more informative reflection of microscopic processes in the focal zone, were considered: 1) ULF electromagnetic emission and 2) acoustic emission. The main focus of the study is to detect micro cracks by the ULF emission records before the process in the focal zone of the earthquake. Formerly specific precursors of strong earthquakes such as Spitak, Loma Priyeta, Guam, Biak earthquake in the Ultra-Low Frequency range have been appeared from several weeks to several days. Earthquake precursors are formed in the focal area and are spread to the ULF receivers. Since the dynamics of earthquakes were represented by the characteristic of the self-organized depression, attempts were made to use fractal analysis for the seismic ULF emission as a non-linear process for the Guam earthquake. In August, 1993, the Guam Earthquake was compared with the results of UAT electromagnetic research with two different methods: 1) Monofraction analysis; and 2) Flukker spectroscopy. Such comparison of the results of different methods of observed data allows to check the reliability of the results and to draw conclusions about the processes taking place in the lithosphere.
Investigation of the succession of earthquake using ultra low frequency (ULF) data in the Izu Peninsula
The application of the ULF for the study of the earthquake sequence was reflected in the work of [34]. Geomagnetic data was recorded by two networks located at Izu Peninsula and Boso Peninsula from 1 February 2000 to 25 July 2000. It consists of both Torsion Magnetometers with triple components and three magnetic stations are equipped with a GPS system to synchronize the data at 50 Hz and 12.5 Hz discrete frequencies. The configuration of the network reminds the triangle 5-8 km of the distance between the stations. For the Izu network, the average distance from the epicenter of the earthquake series is about 80-100 km, and Boso network is 130-150 km. five earthquakes with magnitude 5 earthquakes were recorded in earthquake episodes. The accurate statistical analysis showed that M≥3 had magnitudes and up to 7000 shakes with very large seismicity. Four hourly night recordings were obtained from two magnetic network networks covering f = 0,001-0.3 Hz frequency intervals for 5-speed semi range.
Low rates (0,003-0, 01 Hz and 0.01-0.03 Hz) at low frequencies within a month before the earthquake sequences that started just before the earthquake series emerged as a result of geomagnetic activity in the range of ULF in the summer of 2000 before the earthquake series in Izu Peninsula, reduction of polyarylate in high-frequency diapason.
Specific ultra-low frequency (ULF) precursors of the strong earthquake in Chi-Chi district of Taiwan
Another example of the use of ULF geomagnetic data was found in [35] for the detection of potential earthquakes. Here on the island of Taiwan, 7.5 magnitude earthquakes in Chi-Chi at 01:47 local time on 21 September 1999 was reviewed. Its epicenter is approximately 120 km from the Lunping Observatory where the magnetic field measurements are taken. The measurements were performed with 1 sec discrete displacement frequency with ferrozond magnetometer.
While observing the behavior of geomagnetic components at different frequencies, a significant change in frequency of 0.01 Hz was detected. This frequency is known as one of the main characteristics of the seismic ULF emission. The change in the polarization parameter at 0.01 Hz seems to be a significant increase in the degree of polarization two months before the earthquake and its high price until the earthquake.
Results
Based on observations of the earth's natural electromagnetic field a type of computerized technological complex of magneto telluric monitoring of geodynamic processes was created. This also allows us to obtain objective information about both geoelectric cutoff and electromagnetic fields generated within the Earth at quasireal times. Experimental materials obtained as a result of the use of such a complex in the Bishkek geodynamic polygon over several years demonstrated a high level of informativeness of following the geodynamic processes, from the point of view of detecting correlation relationships between geotechnical cuts and changes in the interior.
The researches have shown that the range of 0.012-25 sec is more informative to find the correlation of seismic activity and magneto telluric parameters. It was also determined that the alleged resistance would detect correlation with seismic activity. At this point, the maximum value of neutron network errors can be measured at the same time when xy and yx resistance components were used.
So, it was not possible to determine the interaction between the investigated components of the Vize-Parkinson matrix and the parameters of induction vectors at low frequency intervals for the results of the multifaceted studies of the geomagnetic field by the investigators in Kamchatka Peninsula.
The results of the researches showed that the growth of the alleged resistance corresponds to the reduction of the phase; the decrease in ρT is accompanied by the growth of the phase. The daily change in the resistance and phase in the region investigated is induced by nature and covers all layers of the Earth's crust up to H = 7-8 km depth.
When comparing the results of the studies by the help of these methods, the following conclusions were obtained.
1. The observation data for one year (January-December 1993) were analyzed at a range of ± 1.5 years from the time of change of polarization in 0.01 hers range. a - the seismic energy allocated in the magnetic unit; Sz / SG - change of polarization; c - The index of the Kupec. The 10 day smooth change of the polarization of the earthquake with a thick line is described. There are some very important effects in nearby period of earthquakes.
2. It may be considered that precursor effects begin three months before the earthquake, and the process of transformation (change) of the environment is likely to occur in the interval of three months before the earthquake and a few months after the earthquake.
3. Both methods of processing have good conclusions on the search for earthquake precursors in the lithosphere three months before the earthquake. Flicker-rush spectroscopy has shown that there are five rattles in the earthquake, with a significant increase in mono-fractal parameters during ULF records.
4. Some rattles of Flicker-rush spectroscopy are likely to indicate step-by-step changes in the lithosphere before the earthquake, in accordance with the self-organized critical process.
Industrial noise is generally higher than the natural signal, but the electromagnetic emission is associated with seismic events. Therefore, the results need further processing to separate ULF emissions.
According to the results of the studies, it can be concluded that the apparent variation of the polarization parameter and its temporary change before the Chi-Chi earthquake may have a temporary change of the polarization in the frequency range of 0.007-0.013 Hz (Z / G) throughout the analyzed period.
Discussion
In world experience of electromagnetic researches, there are numerous examples of positive results of magneto telluric experimental studies for monitoring geodynamic processes in seismic active regions. The most promising results in this direction were recorded with low frequency electromagnetic signals in the ULF range. Thus, sharp increase in electromagnetic noise of ULF parameters was observed in Spitak and in Loma Prieta and in some other cases up to 100 km from the epicenter during 2-4 hours before the earthquake happened. However, attempts to explain the high amplitude of these signals have faced some difficulties.
Conclusion
Electromagnetic monitoring studies carried out in the areas mentioned in the article show that there is a need for further expansion in this area. That's why the work done in this direction can lead to further improvements in researches.
REFERENCES
- Levshenko VT. Ultra-low-frequency electromagnetic signals of lithospheric origins. Joint Institute of Physics. O Yu Shmidt RAS, Moscow, 1995:36.
- Sobolev GA, Demin VM. Mechano-electric phenomena in the Earth. Moscow: Nauka. 1980:215.
- Gershenzon N, Bambakidis G. Modelling of seismo-electromagnetic phenomena. Rus J Earth Sci 2001;3(4):247-75.
- Dedov VP, Omelchenko OK, Trigubovich GM, et al. About prospects of exploration by the method of passing seismic waves of natural endogenous origin. Geophys 2006;3:30-40.
- Hayakawa M. Atmospheric and ionospheric electromagnetic phenomena associated with earthquakes. Tokyo:Terra Scientific Publishing Company, 2003:996.
- Levashov SP, Samsonov AI, Yakimchuk NA, et al. The use of geoelectric methods in conducting reconnaissance studies on oil in Western Kazakhstan. Geoinfo 2004;1:21-51.
- Lukin AE. Direct search for oil and gas: the reasons for failures and ways to improve efficiency. Geologist of Ukraine, 2004;3:18-43.
- Makarova LN, Shirochkov AV, Koptyaeva KV. Magnetopause of the Earth's magnetosphere as an element of the global electric circuit. Geomagn Aeronomy 1998;38(3):159-62.
- Rishe L, Ye E. Cosmic electricity in the atmosphere. Reports of the Russian Academy of Sciences, 1996;5:679-81.
- Kovalev RP. Forecast study of the oil and gas potential of the Kostanai hydrocarbon field based on remote sensing data. M : Publishing house "Axion-M", 2006:85.
- Gulelmi AV, Problems of the physics of geoelectromagnetic waves, Fizika Zemli 2006;3:3-16.
- Gulelmi AV, Levshenko VT. Inertial mechanism of seismomagnetic signal generation. Reports of the Russian Academy of Sciences, 1993;329(4):432-4.
- Davidov VA, Zykov VS, Mikhailov AS. Kinematics of autowave structures in excitable media. Uspekhi Fizicheskikh Nauk 1991;161(8):45-86.
- Svetov BS, Gubatenko VP. Electromagnetic field of mechanoelectric origin in porous moisture-saturated rocks, Fizika Zemli 1999;10:7-73.
- Svetov BS. To the theoretical justification of the seismoelectric method of geophysical exploration. Geophys 2000;1:28-39.
- Corwin RF, Morrison HF. Self-potential variations preceding earthquakes in central California. Geophys Res Lett 1977;4:171-4.
- Noritomi K. Application of precursory geoelectric and geomagnetic phenomena in China report by Japanese Seism Soc. Delegation to Peoples Republic of China, Skism. Soc. Japan. 1978:57-87.
- Varotsos P, Alexopoulos K. Physical properties of the variations of the electric field of the earth preceding earthquakes. Tectonophysics 1984;110:99-125.
- Shuleykin VN. Use of surface atmospheric electricity in the search for geological heterogeneities and control of geodynamic processes. Geophysics of the XXI century: 2001. Sat. of the third geophysical readings to them. VV Fedynskii (February 22-24, 2001, Moscow), Moscow: The Scientific World, 2001.
- Yushko VA. Multivariate analysis of time series of electroteluric data at the upper Paratunka (Kamchatka). Vestnik kraunts. Sciences about the Earth, 2007;9:159-68.
- Bogdanov YA, Voronin VI, Uvarov VN, et al. Electromagnetic manifestation of the structure of the interior. Geophys J 2003;25(4)
- Shuman VN. Modes and systems of electrosounding in dispersive media. Geophys J 2000;5:22-32.
- Shuman VN. Electromagnetic sounding of the geological environment: problems and paradoxes. Geoinform, 2003;4:30-42.
- Landau LD, Lifshits EM. Electrodynamics of continuous media. Moscow: Nauka, 1959: 532.
- Novruzov ES, Jalalova NŞ. Materials of the republican scientific conference on actual problems of geology, Baku. "Study of electromagnetic fields in geodynamic active areas / 89th anniversary of H. Aliyev".2012:179.
- Kerimov KM, Abiyev RG, Melikov TG, et al. Matematical model of petrophysical properties of rocks. Geophysics news in Azerbaijan, 1999;3:35-7.
- Kerimov KM, Novruzov ES, Veliyev HO, et al. Earthquake forecasting method. Eurasian patent #007086, EAPO, EAPV-#14007087-14. 2006.
- Kerimov KM, Agaguliyev GB. Electrimagnetic sounding feasibility to forecast earthquakes. Geophysical news in Azerbaijan, 2001;1:22-4.
- Kerimov KM, Agaguliyev GB. Storm-term earthquake forecasting potensial based on elektromagnetic data. Geophysical news in Azerbaijan, 2005;2:5-8.
- Barell JA, Peters L. Propagation of low-frequency video pulses in media with losses. Tr. Institute of Ing on electrical engineering and radio electronics (TIIER), 1979;7:6-18.
- Larsen IC, Mackie RL, Manzella A, et al. Robust smooth magnetotelluric transfer functions. Geophys J Int 1996;124:801-19.
- Larsen IC. Noise reduction in electromagnetic time series to improve detection of seismic-induced signals. J Geomagn Geoelectr. 1997;49:1257-65.
- Mogi K. Predictions of earthquakes. Moscow: Mir, Moscow, 1988:382.
- Sobolev GA. Basics of earthquake prediction. Science. 1993:313.
- Kaufman AA. Introduction to the theory of geophysical methods (Part 2). Electromagnetic fields 2000:483.