Silver nanoparticles as a near-UV contrast agent injected into gel phantom
2 Office of the Chancellor and Center for Nanoscience, Departments of Chemistry & Biochemistry and Physics & Astronomy, University of Missouri–St. Louis, St. Louis, MO 63121, USA, Email: tfgeorge@umsl.edu
Received: 16-Oct-2017 Accepted Date: Nov 16, 2017; Published: 21-Nov-2017
Citation: Letfullin RR, Szatkowski SA, George TF. Silver nanoparticles as a near-UV contrast agent injected into gel phantom J Nanosci Nanomed. December-2017;1(1):9-14.
This open-access article is distributed under the terms of the Creative Commons Attribution Non-Commercial License (CC BY-NC) (http://creativecommons.org/licenses/by-nc/4.0/), which permits reuse, distribution and reproduction of the article, provided that the original work is properly cited and the reuse is restricted to noncommercial purposes. For commercial reuse, contact reprints@pulsus.com
Abstract
Clear gel ballistic phantom is used in medical physics to model the interaction of soft biological tissues with radiation. With emergence of new technologies like nanomedicine utilizing nanoparticles injected into the tumor and activated by optical radiation, it is important to study the optical properties of those particles injected into the gel phantom. For this purpose, we present the results of the spectral measurements of the absorption properties of silver nanoparticles, synthesized and embedded in gel phantom, as well as the index of refraction of the gel phantom at the 632.8 nm HeNe line. We also perform size-dependent Mie diffraction simulations for the absorption spectrum of the silver nanoparticle in phantom tissue over the wide range of the optical spectrum. This analysis indicates an absorption peak in the near-UV range which arises due to silver nanoparticle injection into the gel phantom. The study of the biotissue phantom with embedded silver nanoparticles as a contrast agent should be exploitable for effective imaging of tumors.
Introduction
Gel phantom is widely applied in medical research and training. It is employed to simulate shear stresses in muscle tissue [1], to simulate photo-acoustics [2] and to mimic tissue’s diffuse absorbance and reflectance [3]. Phantom can be designed for specific tissues, such as breast tissue to study early detection of tumors [4]. Phantom is also produced cheaply for the purpose of simulation training [5].
Meanwhile, nanomedicine has applications to targeted photothermal cancer treatment and in-vivo imaging [6-9]. Even without photothermal activation, silver nanoparticles are effective anticancer materials [10], though they can be photothermally activated to create microbubbles or conductively damage cell organelles [11,12]. Metal nanoparticles can be used as contrast agents for magnetic resonance [13] as well as for imaging with x-rays [14,15], optical [16,17] and radiofrequency waves [18].
The goal of our study is the synthesis of silver nanoparticles by silver nitrate dissociation and injection of these nanoparticles into ballistic phantom to measure spectral visibility. Heightened absorption of silver nanoparticles at 400 nm (predicted by Mie scattering theory) over the surrounding tissue would allow for imaging using visible/near-UV light. This would afford another option for the identification of cancerous tissue.
Experiment
This section describes the procedure used for synthesis of silver nanoparticles. The reaction of interest is the following:

The reaction generates monoatomic silver atoms which cluster into nanoparticles. The synthesis is conducted through the following steps: (1) preparation of a 2.06 mM ± 0.02 mM a of sodium borohydride solution, (2) preparation of a 1.00 mM ± 0.0 2 mM silver nitrate solution, (3) removal of a 90 mL ± 2 mL sodium borohydride solution to an Erlenmeyer flask, and (4) slow introduction of a 6.0 mL ± 0.1 mL silver nitrate solution to the sodium borohydride solution while the latter magnetically stirred as shown in Figure 1. Control of the resulting nanoparticles is established through alteration of the ‘reaction time,’ or the time between silver nitrate addition and the addition of 30 drops of a 3.05 g/L PVP solution, which stabilizes the silver particles.

Figure 1: Silver nanoparticle fabrication by silver nitrate dissociation.
Several reaction times are carried out, ranging from five minutes to four hours, resulting in six samples with different sizes of Ag nanoparticles (Figure 2).

Figure 2: Several batches of silver nanoparticles prepared by different reaction times.
Spectral Measurements
The spectral measurements are performed for silver nanoparticles in water with 1.87mM sodium borohydride (and trace amounts of diborane and sodium nitrate which do not interfere with readings) and in gel phantom by using an Evolution 300 UV-V is spectrophotometer, shown in Figure 3.

Figure 3: Evolution 300 spectrophotometer used for spectral absorption data collection.
The results of absorption measurements for a nanoparticle solution over wide wavelength range from 200 nm to 1100 nm are shown in Figure 4. The batches are prepared on two separated days following the same procedure, which we refer to as batch one or two. The peak wavelength and reaction time are recorded in Table 1 for several trials for two different batches and plotted in Figure 5.

Figure 4: Spectral absorption for nanoparticle solutions in batch two.
| Batch | Reaction Time (min) | Peak Wavelength (nm) |
|---|---|---|
| 1 | 5 | 399.1 0.2 |
| 25 | 401.4 0.2 | |
| 240 | 392.7 0.2 | |
| 2 | 30 | 402.1 0.2 |
| 60 | 400.3 0.2 | |
| 90 | 401.1 0.2 | |
| 120 | 400.7 0.2 | |
| 150 | 400.3 0.2 | |
| 180 | 399.2 0.2 |
Table 1: Peak wavelength and reaction time data from two different preparations of nanoparticles.

Figure 5: Peak wavelength for varying reaction time on two dates.
Theory
We model the nanoparticle radii based on Mie scattering theory by using MiePlot software. Mie theory is an extension of electromagnetics which solves for the amplitudes of the resonant spherical electromagnetic modes in dielectric spheres exposed to planar electromagnetic waves of a certain frequency based on an application of boundary conditions. We complete simulations for different sizes of silver nanoparticles, with a central size of 18.5 nm and standard deviation of 4 nm according to a lognormal distribution of sizes. The results of the simulation are presented in Figure 6 and Table 2.

Figure 6: Mie theory simulations and spectral measurements of absorption curves for silver nanoparticles.
| Batch | Reaction Time (min) | Central Radius (nm) |
|---|---|---|
| 1 | 5 | 19.2 |
| 1 | 25 | 20.9 |
| 1 | 240 | 14.2 |
| 2 | 30 | 20.6 |
| 2 | 60 | 19.4 |
| 2 | 90 | 20.0 |
| 2 | 120 | 19.7 |
| 2 | 150 | 19.3 |
| 2 | 180 | 18.6 |
Table 2: Regressed radii of the silver nanoparticles using Mie theory.
The result of the simulations shows that Mie theory describes very well the absorption spectrum of silver nanoparticles, predicting a correct peak at 400 nm and a gradual decline in absorption in the range from 250 nm to 350 nm. The full width at half maximum in the absorption model is not as wide as the data collected, implying that the spread of nanoparticle sizes is greater than. The dissociation method generates nanoparticles with a wide range of sizes. Mie theory can analyze the peak wavelength to extract the central radius in a size distribution of silver nanoparticles for each reaction time. These results are presented in Table 2. The central radius values are obtained by adjusting Mie spectral simulations until the peak wavelength in the absorption curve matches the peak wavelength in the experimental data collected.
Optical Properties of Gel Ballistic Phantom
The phantom we employ is 10% gelatin produced by Clear Ballistics to mimic the stress effects of human muscle tissue. The Evolution 300 UV-V is Spectrophotometer is used to collect an absorption curve for the phantom which are presented in Figures 7 and 8.

Figure 7: Spectral absorption of phantom for broad wavelengths.

Figure 8: Absorption spectrum of the ballistic phantom.
We compare the spectrum of phantom to the optical fat tissue spectra compiled by [19]. Fat shows a water-driven peak near to 750 nm as well as a strong absorption peak at 930 nm and another near 1050 nm. Fat also shows a decline in absorption from 400 nm to 700 nm. The strong absorption peaks at 930 nm and at 1050 nm are represented in the phantom tissue as well, although the strength of the peak in real fat tissue is substantially stronger. The decline in absorption from 400 to 700 nm is also represented in the ballistic tissue. Thus, the used phantom approximates properly the optical properties for the real biological tissue in the spectral range from 400 to 1050 nm.
Absorption Spectrum of AG Nanoparticles Embedded in gel Phantom
The phantom samples are razor-cut to 1.5 cm × 1.5 cm × 4 cm, and a hot aluminum rod is used to melt out an injection hole of 3mm diameter through the vertical center of the phantom sample as shown in Figures 9 and 10.

Figure 9: Scale model of a phantom sample with melted hole.

Figure 10: Actual phantom images with melted hole.
The phantom samples are inserted into the spectrophotometer slot and scanned over the wavelength range of 100 nm to 1100 nm. A 0.3 mL silver nanoparticle solution is then injected into the melted hole inside the phantom, and the phantom-solution sample is scanned again. A direct injection of the silver nanoparticles into the phantom instead of melting the phantom’s hole is not seen to be successful because the small phantom block cracked from the pressure of injected solution and the nanoparticles leaked out. The process of melting a hole and then filling it with nanoparticle solution reduces the mechanical stress on phantom block and keeps it solid. The results of the spectral measurements of the phantomnanoparticle system are presented in Figures 11 and 12.

Figure 11: Absorption spectrum of phantom before and after the injection of silver nanoparticles.

Figure 12: Absorption change from before to after injection of nanoparticles for different reaction times.
The injection of the silver nanoparticle solution causes the phantom’s total absorption intensity to decrease. Before the injection of the nanoparticle solution, the large index difference between phantom and air gives rise to a scattering effect by the melted hole in the phantom on the boundaries of phantom-hole and phantom-air. This effect widens the divergence angle of the scattered light causing less light to reach the detector. When water is added to the hole, the index difference between phantom and water is smaller, and more light reaches the detector. Consequently, we read lower absorption in transmitted light after the injection of solution for all wavelengths in the visible range of the spectrum. This effect should not appear when nanoparticles are injected with no melted hole. We support this claim with a measurement of the phantom index of refraction discussed in the next section (n=1.437 ± 0.026).
A new strong absorption peak in the phantom spectrum is notable at 400 nm corresponding to the absorption of silver nanoparticles. Figure 12 shows the difference in absorption before and after the injection of nanoparticles for many trials. The new peak is clearly visible and suggests imaging opportunities using silver nanoparticles as a contrast agent in biological tissues at 400 nm. Based on a MiePlot simulation, the best nanoparticle radius for 400 nm imaging is 19 nm.
We attribute the variation in peak amplitude from trial to trial to the variable position of the melted hole in the phantom. We did not use an instrument to standardize this hole location, so it is vulnerable to small angles of inclination and also misalignment with the center of the block. These changes as well as the nanoparticle size variation would affect the peak absorption in Figure 12. However, the NP size variation was small in our experiment (most NPs are in the range from 18.5 nm to 21 nm). Because of this, the NPs size variation effect is difficult to separate from the effect of hole placement in the performed experiments.
Measuring Phantom’s Index of Refraction
In order to explain the drop in absorption, experiments are conducted to measure the index of refraction of gel phantom. A piece of phantom is cut to an eight millimeter thickness, and the front and back faces of the phantom are melted at low temperature to remove the abrasions made to the surface and flatten those faces. The phantom is suspended, and a helium-neon 632.8 nm laser is positioned to pass through the phantom and reach an optical power meter as shown in Figure 13. We assume that in the thin piece of the phantom, reflection losses are much greater than absorption losses.

Figure 13: (a) Phantom sample after melting the front and back face. (b) Experimental setup with the laser passing through the phantom to reach the power meter.
The Fresnel equations [20] are derived by analyzing separately the two orthogonal polarizations of light and invoking boundary conditions (electric field parallel to boundary continuous and magnetic field perpendicular to boundary continuous). The resulting equations are:
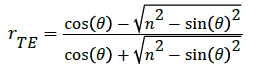 (2)
(2)
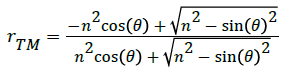 (3)
(3)
The equations are squared and subtracted from one to attain transmittance for each polarization. Both are equal to the following when :
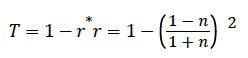 (4)
(4)
So for the front and back surfaces, we have
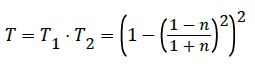 (5)
(5)
The laser power is measured, and then the phantom is inserted. The phantom is tilted until the power is maximized (to make θ=0), and then the power is measured again. Uncertainty is carried through to transmission, and then (5) is used to find a real part of the phantom’s index of refraction n=1.437 ± 0.026 We use this measurement to demonstrate that the index mismatch with air (approximately 0.44) is much greater than the mismatch with water (approximately 0.11), and therefore, we can explain the absorption decrease. The melted hole scatters, resulting in less light after the addition of the water.
Conclusion
The results of this research can be summarized by following conclusions:
• Nanoparticles are synthesized using silver nitrate dissociation.
• Nanoparticles are optically validated as spheroid and compared to the Mie model to find radii from 14 nm to 20 nm, depending on the reaction time before PVP addition.
• The gel Phantom’s spectrum is obtained and shown to mimic fat peaks above 900 nm and general trends from 350 nm to 700 nm.
• Nanoparticles are injected into the gel phantom and are shown to generate a new and visible absorption peak at 400 nm, which should be exploitable for imaging tumors by using silver nanoparticles as contrast medium. To exploit that band, one should use 19 nm silver nanoparticles.
• The index of refraction of the ballistic phantom is measured as 1.4370.026 according to a zero-angle transmission measurement on a thin piece of gel phantom with melted-flat front and back faces.
REFERENCES
- Lee H, Lee J, Shin J, et al. Shear wave elastography using ultrasound: effects of anisotropy and stretch stress on a tissue phantom and in vivo reactive lymph nodes in the neck. Ultrasonography 2017;36:25-32.
- Vogt W, Jia C, Wear K, et al. Development and validation of a biologically realistic tissue-mimicking material for photoacoustics and other bimodal optical-acoustic modalities. SPIE Proc 2017.
- Hagen A, Freyer R, Grosenick D, et al. Depth-sensitive detection of absorbing objects in a liquid tissue phantom from diffuse reflectance. Proc. IASTED Int. Conf., BioMed (Innsbruck, Austria) 2017;42-8.
- Triana D, Cristiano K, Gutierrez J, et al. Mechanical characterization of a breast phantom. IFMBE Proc 2016;60:489-91.
- Wilson J, Ng L, Browne V, et al. An easy-to-make, low-cost ultrasound phantom for simulation training in abscess identification and aspiration. J Ultrasound Med 2017;36:1241-4.
- Letfullin RR, George TF. Computational Nanomedicine and Nanotechnology: Lectures with Computer Practicums 2016.
- Singh D, Minz A, Sahoo S. Nanomedicine-mediated drug targeting of cancer stem cells 2017;22:952-9.
- Liu J, Zheng X, Yan L, et al. Bismuth sulfide nanorods as a precision nanomedicine for in vivo multimodal imaging-guided photothermal therapy of tumor. ACS Nano 2015;9:696-707.
- Letfullin RR, George TF. Nanotherapy of cancer by photoelectrons emitted from the surface of nanoparticles exposed to nonionizing ultraviolet radiation. Nanomedicine 2017.
- Shaswat B, Paramita B, Aparna S. Silver nanoparticles as antibacterial and anticancer materials against human breast, cervical and oral cancer cells. J Nanosci Nanotechnol 2017;17:968-76.
- Letfullin RR, George TF. Plasmonic nanomaterials for nanomedicine 2013:1063-97.
- Letfullin RR, Szatkowski SA. Laser Induced Thermal Ablation of Cancerous Cell Organelles. Therapeutic Delivery 2017;8:501-9.
- Kolesnichenko V, Goloverda G, Kucheryavy P, et al. Iron oxide nanoparticles with a variable size and an iron oxidation state for imaging applications. Nanotechnology in Medicine: From Molecules to Humans 2016.
- Letfullin RR, Rice CEW, George TF. X-ray optics of gold nanoparticles, Applied Optics 2014;53:7208-14.
- Hainfeld J, Smilowitz H, O’Connor M, et al. Gold nanoparticle imaging and radiotherapy of brain tumors in mice. Nanomedicine 2013;8:1601-09.
- Letfullin RR, Iversen CB, George TF. Modeling Nanophotothermal therapy: kinetics of thermal ablation of healthy and cancerous cell organelles and gold nanoparticles. Nanomedicine: NBM 7 2011:137-145.
- Letfullin RR, Rice CEW, George TF. Bone Cancer Therapy by Plasmonic Nanoparticles. Therapeutic Delivery 2011;2:1259-73.
- Letfullin RR, Letfullin AR, George TF. Absorption efficiency and heating kinetics of nanoparticles in the RF range for selective nanotherapy of cancer. Nanomedicine: NBM 11 2015:413-20.
- Jacques, S. Optical properties of biological tissues: A review. Phys Med Biol 2013;58:R37-R61.
- Petrotti FL, Pedrotti LM, Pedrotti LS. Introduction to Optics, 3rd Ed. (Pearson) 2007:491-6.