The pockmark stars: radial structures in the seabed surrounding the Hawaii Islands
Received: 21-Nov-2017 Accepted Date: Dec 15, 2017; Published: 20-Dec-2017, DOI: 10.4172/2591-7641.1000009
Citation: Spina R. The pockmark stars: radial structures in the seabed surrounding the Hawaii Islands. J Environ Geol 2017;1(1):33-50.
This open-access article is distributed under the terms of the Creative Commons Attribution Non-Commercial License (CC BY-NC) (http://creativecommons.org/licenses/by-nc/4.0/), which permits reuse, distribution and reproduction of the article, provided that the original work is properly cited and the reuse is restricted to noncommercial purposes. For commercial reuse, contact reprints@pulsus.com
Abstract
Over the last few years the use of advanced satellite and bathymetric detection systems has enabled the identification of pockmark aggregates of different shapes and sizes, which are frequently developed along preferential directions, in many sea basins. The bathymetric observations of the seabed near Hawaii Island revealed the existence of special sea star-shaped structures due to radial alignment and coalescence of pockmark groups. In some areas interactions between very close pockmarks have been observed. Similar star structures have been found in other parts of the world and a common feature is the presence of magmatic underplating. Tomographic images, seismic data and direct observation of about 100 of these structures suggest that the most likely genetic mechanisms are attributable to the stress field induced by rising and stationing of small volumes of magmatic plumes. The presence of these particular structures could be a key to explaining some questions about Hawaii’s magmatism.
Keywords
Pockmark stars, Tomographic images, Radial structures, TectonicIntroduction
The Hawaiian Islands are an example of an age-progressive chain formed by the movement of the Pacific plate over a rise of a thermal plume from the lower mantle [1]. The classic concept of plume, fed by a hotspot more or less fixed in the mantle, which explains Hawaiian volcanism, is questioned by unclear phenomena: the variation of volcanic material erupted over time, asymmetric distribution of the geochemistry of the lava and secondary volcanism occurring in distant areas of the hotspot. These phenomena have been explained by a “small-scale” convection in the mantle that erodes the base of the lithosphere and generates localized lifts distant from the hotspot [2]. Although the main feature of a volcanic chain is the presence of a high bathymetric associated with an abnormally warm mantle, these factors were not found in the seabeds surrounding the volcanic chain of Hawaii. In addition, the previous estimates of the maximum crost size below the Hawaii Islands are in the range of 15 to 20 km [3], while the average thickness in the areas surrounding the swell is about 6.2 km [4].
Some authors [5], through multichannel seismic reflection and refraction data acquired during a wide-aperture two ship experiment, provide evidence for a complex crust-mantle [C-M] transition under Oahu, Hawaii. In details, a 3-6 km thick transition zone, identified with a plutonic complex, extends for distance of 100 Km to the north and south from the center of Oahu. It is believed that much of the Hawaiian magmatism is due to magmatic underplating, i.e., to an accumulation of molten magma derived from the mantle below the existing crust. The volcanism of Hawaii therefore represents only a small fraction of the average of the melt existing at the base of the crust.
The presence of the underplating phenomenon is highlighted by the existence of a low-velocity zone in the upper mantle/lower crust [6]. In the northeastern part of the Hawaii Island there is no underplating and therefore it is believed that the volcanism in this area is fed from the bottom rather than the sill from the center of the chain islands.
In the west side of the Mauna Loa, craters radially arranged with respect to the volcanic caldera [7] have been observed: in particular, ten of them are submarines and sixty-six subaerous [8].
Yokoyama I [9], observes that the distribution of the parasitic vents, with respect to the central axis of polygenic volcanoes, is quite different and classifies them into three categories: individually radial, directionally radial and annular. It is also defined a shear stress field model with the development of the twin vents identified in various volcanoes. This approach, however, cannot be universally applied to any volcano for the different effects of volcanism and the excessive simplification that characterizes the model.
In the submarine areas of Hawaii, as well as in many other marine areas of the world, there are special structures, called pockmarks, due to rising of fluids which, under unstable conditions, can generate hemispheric depressions of different size and depth.
The distribution of these particular structures does not show any particular geographical restrictions being extended to different marine areas of the world: they are present in the high latitudes [10-12] and at tropical and equatorial latitudes [13,14].
Pockmarks are frequently associated with gas fields and, in some cases, are distributed along preferential directions due to the existence of deep tectonics discontinuity [faults]. In some areas of the world, they are associated with the rise of salt diapirs which, by interrupting the continuity of the overlying terrains, facilitate rising of gas [predominantly methane] and liquids [hydrocarbon oils and other].
In the specific areas of the world, “giant pockmarks” have been identified: in the carbonate platform of the Maldives [Indian Ocean] these depressions reach a diameter of 3000 m and a depth of 180 m [10]. On the seafloor of the Chatham Rise, about 500 km east of Christchurch, three giant pockmarks have been discovered by Germany, USA and New Zealand scientists. Their size is 11 Km by 6 Km in diameter and 100 m deep. Scientists believe that large degassing from under the seafloor into the ocean has created these structures. Currently there is total absence of gas emitted.
The pockmarks play a very important role also in the field of scientific studies aimed at economic purposes: the majority of pockmark research has been driven by the oil and gas industry, in terms of their usefulness as an exploration tool [15] or as indicators of hydrocarbon sources for prospecting [16].
In fact the presence of methane emitted spontaneously [fluid cold seeps] can indicate the existence of a heavy hydrocarbon reservoir near the gaseous reservoir: in this way the pockmarks can be useful indicators of the existence of petroleum [17].
The pockmarks are frequently associated with the rise of hydrate gases that contain highly compressed natural gas that may constitute a significant source of energy [18]. Some nations [USA, India, Japan, South Korea, and China] they funded research programs in the field of hydrate gases to start commercial production of gas from hydrates.
Thus, previous research on pockmarks has been dominated by geological and geophysical aspects. Yet, pockmarks also affect the ecology of the seabed. Soft sediment environments have previously been considered as relatively homogeneous, but pockmarks are now being recognised as important features in structuring topography. Highly structured habitats are important in the generation and maintenance of biodiversity. For example, in soft sediment environments, much of this structure is created by inhabiting organisms in a number of ways [19]. These fauna burrow into and bioturbate sediments, provide hard substrates such as shells, form biogenic reefs, and modify surface topography [20,21].
Regarding the important role played by these particular structures in the field of scientific research, through the analysis of the pockmarks distribution in the seabed of Hawaii and their morphometric characteristics, they want to formulate hypotheses about the genesis of particular radial structures observed, named by the author “pockmark stars”, and establish any correlations with similar morphologies present in other parts of the world.
Methods
Two main approaches have been adopted to define the distribution and the structural, morphological and a morphometric characteristic of the pockmarks stars:
(i) An empirical approach based on direct observations of satellite images of the seabed colonized by these particular structures. The observations were supplemented by experimental data with the help of seismic lines and surveys, available in the literature, to identify any deep sources capable of generating seastar shapes.
(ii) An analytical approach to establish possible correlations between some morphological [topographical gradient of the central part] and morphometrics [length of the arms] characters of the stars. To this end, the Pearson correlation index has been calculated to verify the existence of any correlations between the two previously defined characters and some graphs [aerogram and histogram] have been created to constrain, in a statistical way, the main morphostructural parameters of the stars.
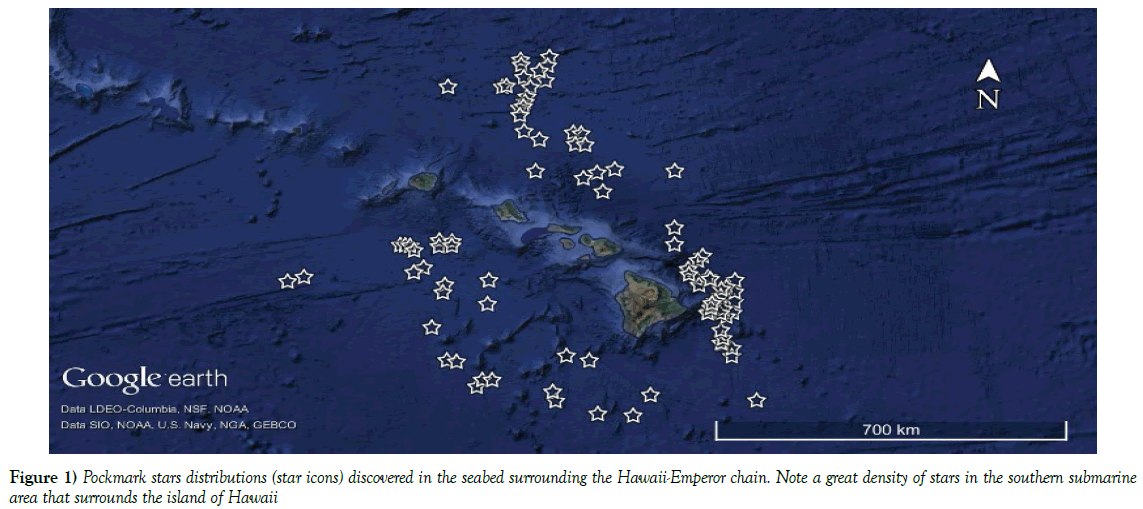
With the aid of bathymetric imagery [Google Earth Pro version 7.1.5.1557 and Geo Map App - Marine Geoscience Data System] extensive oceanic crust portions were analyzed to identify new peculiar structures generated by pockmarks. During observations, in an ocean area near the Hawaiian Islands, special shapes with radial distribution of the pockmarks were identified (Figure 1). At first it was thought that the image displayed on the screen was the result of an artifact, but the detection of extensive marine surfaces colonized by similar forms and the observation of the same morphologies in images acquired by other companies [22], gave the certainty of being in the presence of a unique phenomenon of its kind. The use of some tools available in Google Earth Pro [line for measuring distances on a straight, path for the measurement of distances on a broken, altitude profile] has allowed some important parameters to be calculated: the surface of the sea bottom affected by these phenomena, the length of the arms, the number of pockmarks per arm, the morphology of the center of the star [depressed or lifted]. The greatest difficulties in the correct interpretation of the images are linked to environmental changes [erosion caused by endogenous and exogenous factors, tectonic events, covering of lavic flows and/or marine sediments] that have frequently obliterated the essential features of the pockmark stars.
Using satellite imagery, similar structures were found in other parts of the world, both in continental and ocean areas.
To define the genesis of these particular structures, we analyzed two sets of data, extracts from the works of Leslie SC et al., 2002 and ten Brink US and Brocher MT, 1987:
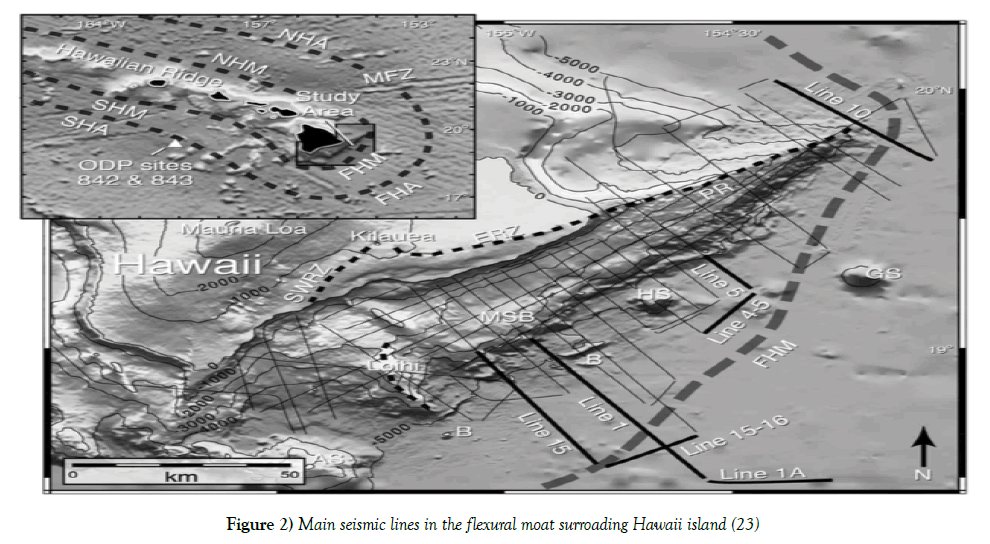
(i) A series of data consisting of a grid of 29 seismic profiles [23] over the FHM and the submarine flanks of the island of Hawaii on the R/V Maurice Ewing towing a 4.2 km, 160 channel streamer cable (Figure 2).
Figure 2: Main seismic lines in the flexural moat surroading Hawaii island [23]
(ii) An estensive data set that includes multichannel seismic refraction profiles [ESPS] and coincident and crossing large-aperture multichannel reflection profiles [5]. A detailed description of these acquisition and processing methods can be found in the work previous mentioned.
Analytical approach was based on the calculation of the Pearson Correlation Index, or linear correlation coefficient, which is an important dimensionless statistical index that allows establishing if there is a linear correlation between variables of different types, independently of the units of measurement chosen. Define the data matrices A={x1,x2,….,xn} and B={y1,y2,….,yn} the Pearson Correlation Index is expressed by the ratio between the covariance of A and B and the their standard deviation:
r=cov(A,B)/(σA∙σB)
In particular —1≤ r ≤1 and the two data sets A and B:
(i) They are directly or positively correlated if r>0 and their positive linear relation becomes stronger when the coefficient approaches 1;
(ii) They are uncorrelated, ie there is no linear dependence between them if r=0;
(iii) They are inversely or negatively correlated if r<0 and their negative linear relation becomes stronger when the coefficient approaches -1.
The condition of perfect linearity is reached when r=±1 with the points perfectly aligned on the same straight line.
Results
The close observation of the radial Hawaiian morphologies has allowed to define the structure of each star arm consisting of a variable number of aligned and often coalescing pockmarks.
About 100 pockmark stars have been identified, located mostly in the southeast offshore of Hawaii island, and their arms have a variable length from 4 km to 11 km. Table 1 shows a classification of the 90 stars identified in the offshore islands of Hawaii which show the geographical coordinates [latitude and longitude] and the average length of the arms of each star, while the “Center of star” field provides information on the topography of the central part of the star and on the corresponding vertical variations [height gradients]. In the convergence zone of the star arms, three main topographical conditions have been identified:
TABLE 1 Pockmark stars (Hawaii islands)
| Star | Latitude | Longitude | Center of star | Average length of the arms (Km) | Gradient of height (m) |
|---|---|---|---|---|---|
| S1 | 19.413723° | -153.952389° | flat | 8 | 4 |
| S2 | 19.334541° | -154.071379° | flat | 8 | 0 |
| S3 | 19.404606° | -154.178684° | flat | 7 | 0 |
| S4 | 19.490099° | -154.125301° | topographic high | 6 | 40 |
| S5 | 19.443304° | -154.381356° | topographic high | 8 | 35 |
| S6 | 19.412126° | -154.410468° | topographic high | 5 | 15 |
| S7 | 19.520061° | -154.352104° | topographic high | 8 | 75 |
| S8 | 19.612354° | -154.334295° | topographic high | 5 | 90 |
| S9 | 19.555820° | -154.327342° | topographic high | 8 | 40 |
| S10 | 19.661230° | -154.270045° | topographic high | 6 | 10 |
| S11 | 19.049105° | -154.169863° | depression | 6 | -30 |
| S12 | 18.761444° | -154.137833° | topographic high | 5 | 10 |
| S13 | 18.778831° | -154.166002° | flat | 7 | 5 |
| S14 | 18.878602° | -154.128873° | topographic high | 4 | 10 |
| S15 | 19.764998° | -154.174975° | topographic high | 8 | 30 |
| S16 | 19.908651° | -154.163178° | flat | 5 | 0 |
| S17 | 19.949511° | -154.071826° | flat | 7 | 0 |
| S18 | 19.850041° | -153.921552° | topographic high | 7 | 25 |
| S19 | 19.643770° | -153.924865° | depression | 5 | -20 |
| S20 | 20.159701° | -154.405129° | flat | 8 | 3 |
| S21 | 20.222891° | -154.749030° | depression | 10 | -80 |
| S22 | 20.329717° | -154.763358° | topographic high | 11 | 75 |
| S23 | 20.603621° | -154.499094° | topographic high | 7 | 10 |
| S24 | 20.843117° | -154.994442° | topographic high | 9 | 55 |
| S25 | 21.191222° | -155.007499° | flat | 10 | 0 |
| S26 | 20.000306° | -154.567493° | flat | 7 | 0 |
| S27 | 20.130972° | -154.609089° | topographic high | 8 | 50 |
| S28 | 20.096277° | -153.916643° | flat | 4 | 0 |
| S29 | 22.400109° | -156.096160° | flat | 7 | 0 |
| S30 | 22.325208° | -156.415915° | depression | 8 | -8 |
| S31 | 22.207562° | -156.661084° | flat | 4 | 0 |
| S32 | 21.935001° | -156.305404° | flat | 4 | 0 |
| S33 | 23.154571° | -156.857962° | flat | 4 | 0 |
| S34 | 23.689684° | -157.780174° | flat | 6 | 0 |
| S35 | 24.749742° | -157.324113° | flat | 8 | 0 |
| S36 | 24.556226° | -157.355094° | topographic high | 8 | 120 |
| S37 | 24.411706° | -157.497555° | flat | 9 | 0 |
| S38 | 24.678366° | -157.857499° | topographic high | 6 | 250 |
| S39 | 24.096027° | -157.661211° | topographic high | 5 | 430 |
| S40 | 23.747450° | -158.992726° | topographic high | 8 | 450 |
| S41 | 22.999508° | -157.471771° | flat | 10 | 0 |
| S42 | 22.373060° | -155.007258° | topographic high | 9 | 15 |
| S43 | 18.497750° | -153.969154° | flat | 4 | 0 |
| S44 | 20.131173° | -154.390202° | flat | 7 | 0 |
| S45 | 23.506819° | -157.840713° | flat | 6 | 0 |
| S46 | 23.661256° | -157.850294° | flat | 7 | 0 |
| S47 | 23.897776° | -157.719757° | flat | 7 | 0 |
| S48 | 24.306387° | -157.789705° | topographic high | 7 | 350 |
| S49 | 20.056580° | -158.313766° | flat | 6 | 0 |
| S50 | 20.862928° | -159.223726° | topographic high | 7 | 45 |
| S51 | 18.337015° | -158.855512° | topographic high | 7 | 50 |
| S52 | 18.359633° | -159.027579° | topographic high | 8 | 350 |
| S53 | 18.507284° | -156.908525° | topographic high | 6 | 15 |
| S54 | 19.042393° | -159.310468° | topographic high | 8 | 55 |
| S55 | 24.244672° | -157.388261° | topographic high | 7 | 5 |
| S56 | 24.084560° | -159.185143° | topographic high | 10 | 20 |
| S57 | 24.572520° | -157.844540° | topographic high | 7 | 50 |
| S58 | 23.139316° | -156.714634° | flat | 5 | 0 |
| S59 | 22.904207° | -156.639672° | topographic high | 7 | 25 |
| S60 | 22.914392° | -156.815136° | topographic high | 5 | 10 |
| S61 | 23.170555° | -157.754413° | topographic high | 8 | 5 |
| S62 | 22.340485° | -157.527147° | topographic high | 7 | 35 |
| S63 | 19.562073° | -158.326426° | topographic high | 6 | 20 |
| S64 | 19.796423° | -159.107909° | flat | 11 | 0 |
| S65 | 20.193881° | -159.635380° | flat | 8 | 0 |
| S66 | 20.295476° | -159.493762° | topographic high | 8 | 10 |
| S67 | 20.642687° | -159.674269° | flat | 6 | 0 |
| S68 | 20.748435° | -159.927185° | flat | 7 | 0 |
| S69 | 20.743307° | -159.837833° | flat | 9 | 0 |
| S70 | 20.741539° | -159.749460° | flat | 6 | 0 |
| S71 | 20.739095° | -159.225841° | topographic high | 6 | 40 |
| S72 | 20.847919° | -158.994656° | topographic high | 5 | 200 |
| S73 | 20.758790° | -158.996373° | topographic high | 6 | 30 |
| S74 | 19.944181° | -159.097164° | flat | 9 | 0 |
| S75 | 20.008400° | -161.666911° | topographic high | 7 | 110 |
| S76 | 19.900031° | -161.967223° | depression | 7 | -10 |
| S77 | 17.743197° | -157.139961° | depression | 10 | -20 |
| S78 | 17.969554° | -158.216233° | depression | 10 | -90 |
| S79 | 17.546238° | -157.086632° | topographic high | 8 | 50 |
| S80 | 17.282772° | -156.337458° | topographic high | 10 | 240 |
| S81 | 17.964868° | -158.389292° | flat | 8 | 0 |
| S82 | 17.249389° | -155.713475° | depression | 7 | -30 |
| S83 | 17.817424° | -158.486515° | topographic high | 6 | 45 |
| S84 | 17.552413° | -153.515068° | depression | 8 | -50 |
| S85 | 17.687843° | -155.412185° | flat | 7 | 0 |
| S86 | 20.507588° | -154.584086° | flat | 4 | 0 |
| S87 | 18.408418° | -156.502968° | topographic high | 9 | 50 |
| S88 | 24.562604° | -157.353417° | topographic high | 8 | 120 |
| S89 | 18.665275° | -153.964557° | flat | 5 | 0 |
| S90 | 23.789662° | -157.749118° | topographic high | 7 | 15 |
Classification of the pockmark stars. Latitude and longitude are expressed in decimal degrees
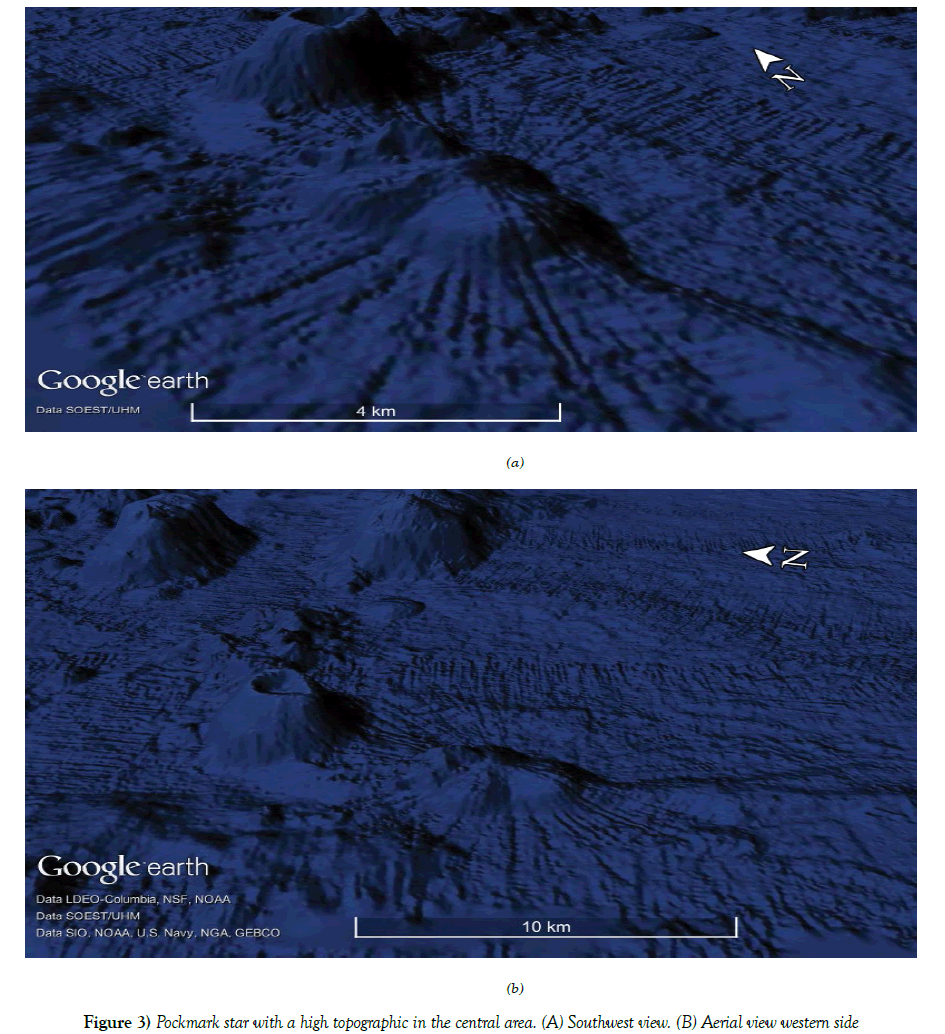
1. Topographic high, with the central part of the star raised compared to the opposite seabed (Figures 3A and 3B);
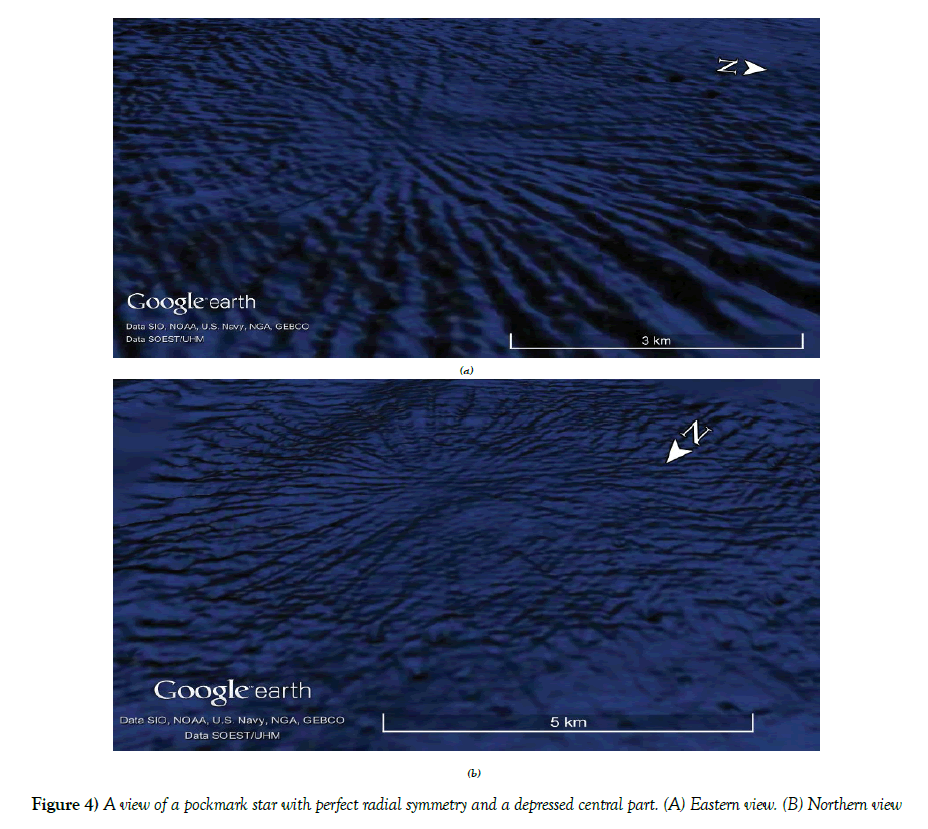
2. Depression, with sinking of the central part of the star (Figures 4A and 4B);
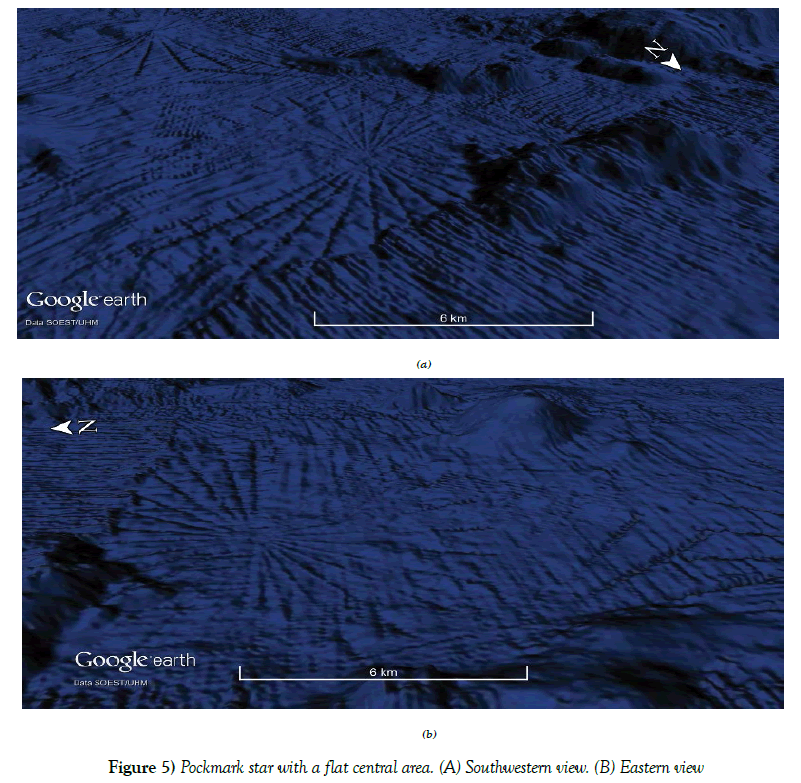
3. Flat, with absence of the topographic gradient between the center and the peripheral part of the star (Figures 5A and 5B).
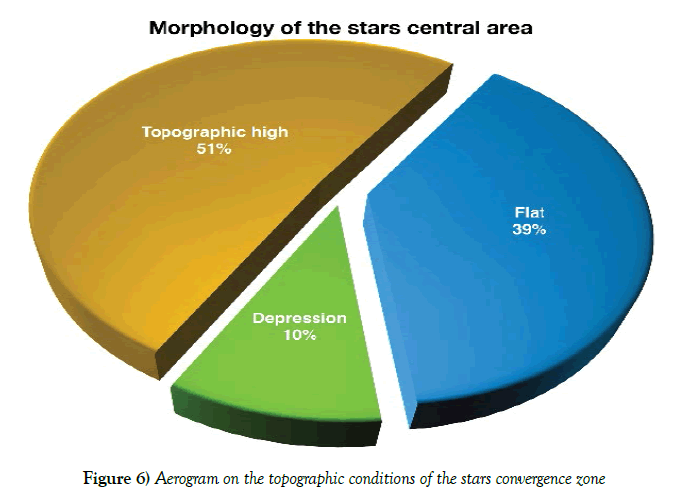
Figure 6 shows the aerogram of the absolute frequencies for the three topographical conditions [topographical high, depression and flat] of the central part of the star: half of the stars have the central part raised while only 10% of them show a sinking of the part central.
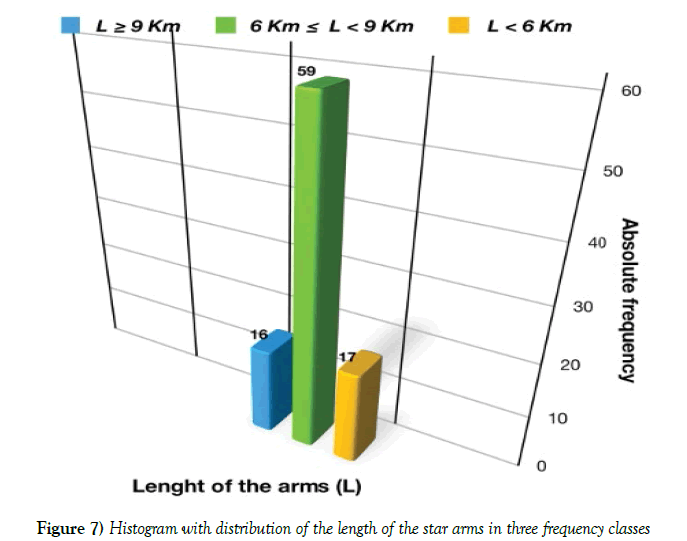
Figure 7 shows the histogram of the average length of the star arms, for the three frequency classes considered, between 4 and 11 km. In particular, class with dimensions between 6 and 9 km [excluded] has the highest frequency peak with about 60 stars that have a size of the arms belonging to this range.
Since most of the stars have a central raised area with variable topographic gradients, we proceeded to define if there is a correlation between the stress induced by the rising of the plume and the increase in length of the star’s arms; in other words we want to establish if the cause of the development of these particular symmetrical forms is superficial [positive correlation] or deep [absence of correlation].
On the basis of the data present in Table 1, the Pearson Correlation Index was calculated, considering only the data series [length of the arms-gradient of height] of stars characterized by a high topographic in the central part. The value of the Pearson Correlated Coefficient obtained is very close to zero [r = 0.014], a value that indicates an absence of correlation between the two variables in question.
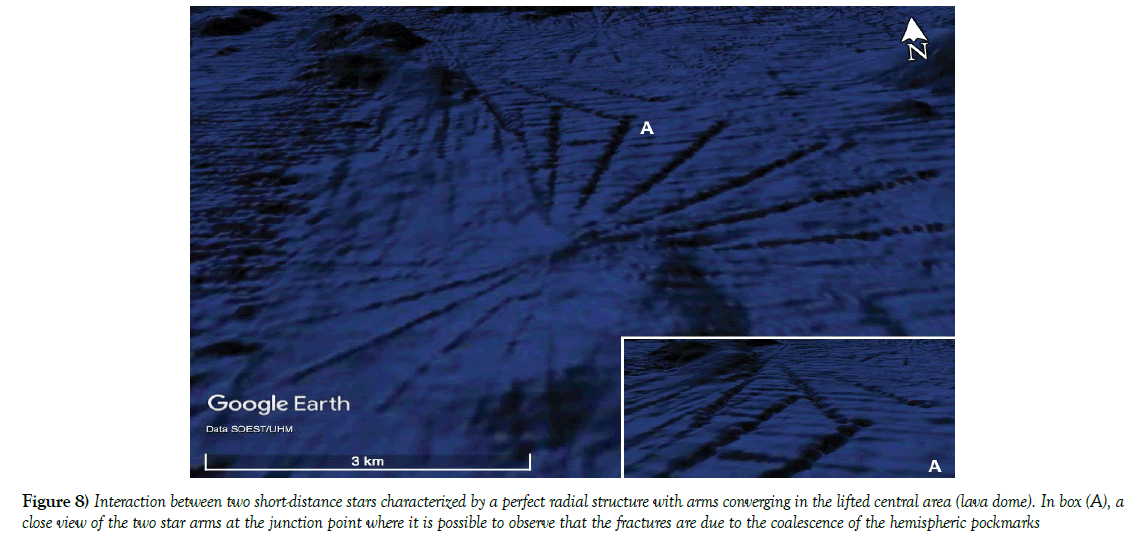
In some cases the nearby star arms can interact with each other by welding together (Figure 8): in box [A] the close view shows the structure of the radial fractures consisting of a succession of aligned and coarse pockmarks and the maximum length of the radial fractures is about 8 km.
Figure 8: Interaction between two short-distance stars characterized by a perfect radial structure with arms converging in the lifted central area (lava dome). In box (A), a close view of the two star arms at the junction point where it is possible to observe that the fractures are due to the coalescence of the hemispheric pockmarks
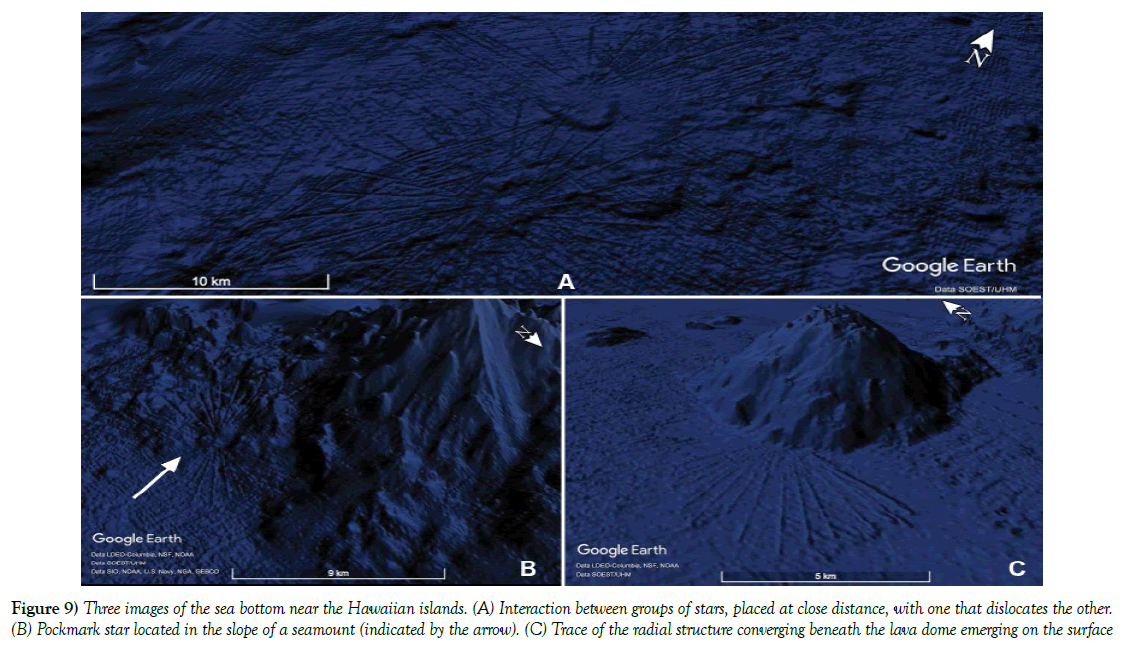
In Figure 9A, the interaction between pockmarks generates strike-slip deformation [right component] with dislocations affecting different star arms. In the same picture you can also observe the superimposition of a star above the other: frequently it is possible to observe several generations of pockmark stars superimposed on each other.
Figure 9: Three images of the sea bottom near the Hawaiian islands. (A) Interaction between groups of stars, placed at close distance, with one that dislocates the other. (B) Pockmark star located in the slope of a seamount (indicated by the arrow). (C) Trace of the radial structure converging beneath the lava dome emerging on the surface
In Figure 9B it is possible to observe a pockmark star present in the slope of a seamount [indicated by the arrow]: the ascent of the lava dome has lifted the portion of the seabed on which the star was previously set. Figure 9C shows the radial geometry of a converging star under a seamount due to rising of a small lava plume.
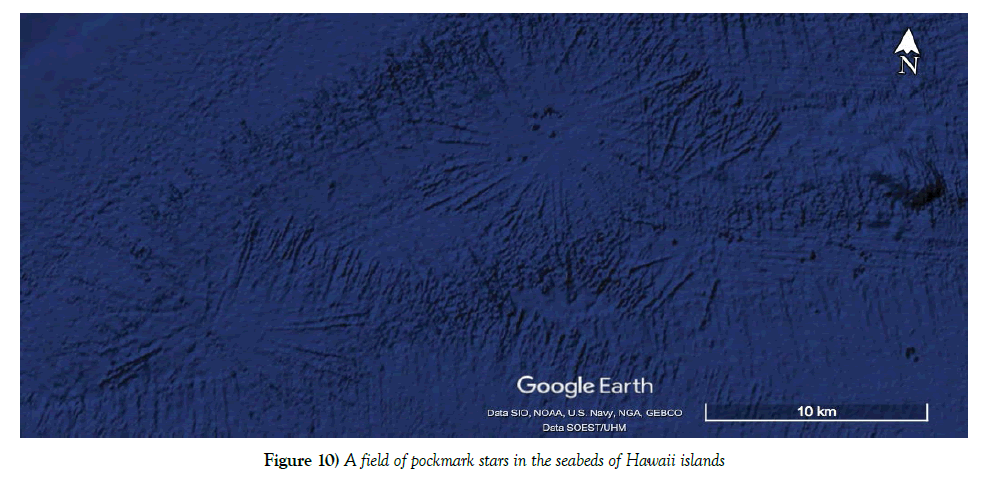
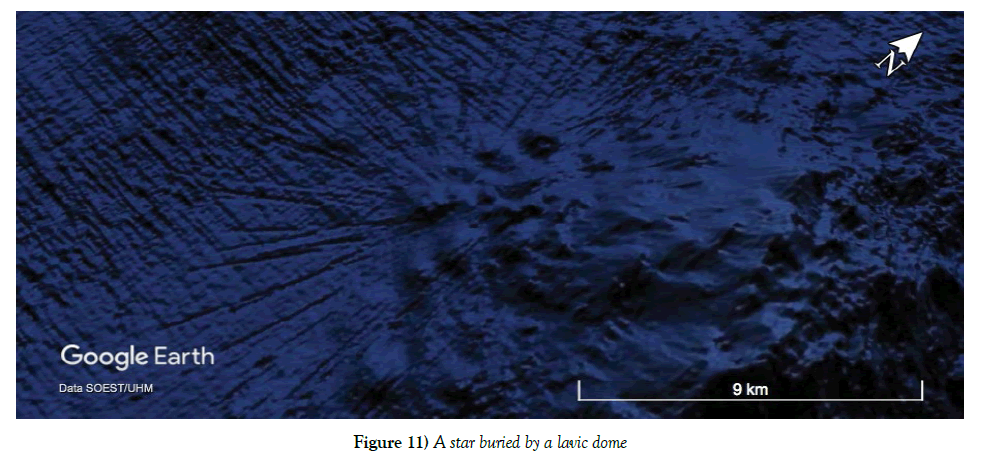
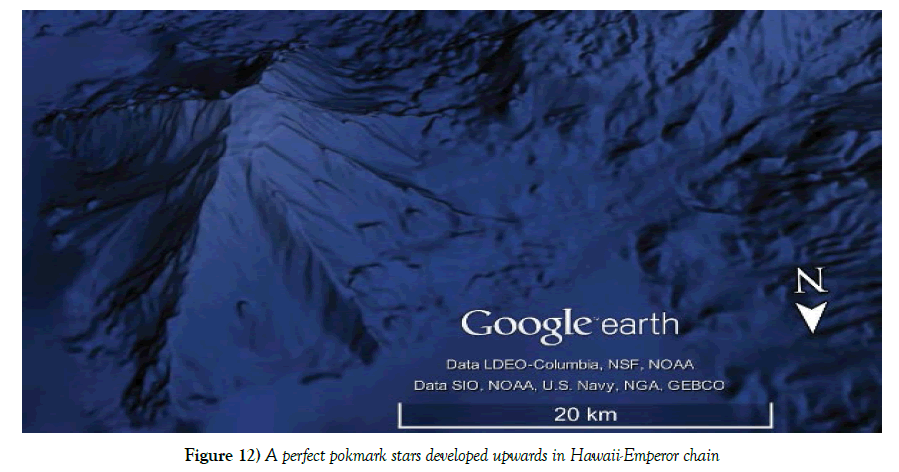
Figures 10 and 11 shows respectively, a field of pockmark stars and a star covered by lavic dome. In Figure 12 the thrust of the underlying plume produces a three-dimensional view of the pockmark stars.
To define the genesis of these particular star structures, we are analized a set of multichannel seismic images made in the Frontal Hawaiian Moat (FHM), in the southeast of the Hawaiian Islands. These images are previously used by Leslie SC et al. [23], to understand stratigraphy and sediment phenomena [debris avalanches or debris flow and turbidites] in the FHM. The analysis of seismic reflectors allowed the authors to distinguish two seismic layer superimposed on the basement: pelagic sediments and volcaniclastic sediments formed by three facies [proximal debris avalanches and slumps, distal debris avalanches or debris flows of turbidites]. The basament is characterized by some important reflective properties: [i] rough and irregular reflector geometry; [ii] underlying low frequency reverberations similar to basement topography; [iii] the region beneath the basement appears free of coherent or continuous reflection events; [iv] a distinctive layer of low amplitude reflections, interpreted as pelagic sediment that drapes the basement reflection. These basement characteristics are consistent with the observations of previous seismic reflection studies [4,24,25].
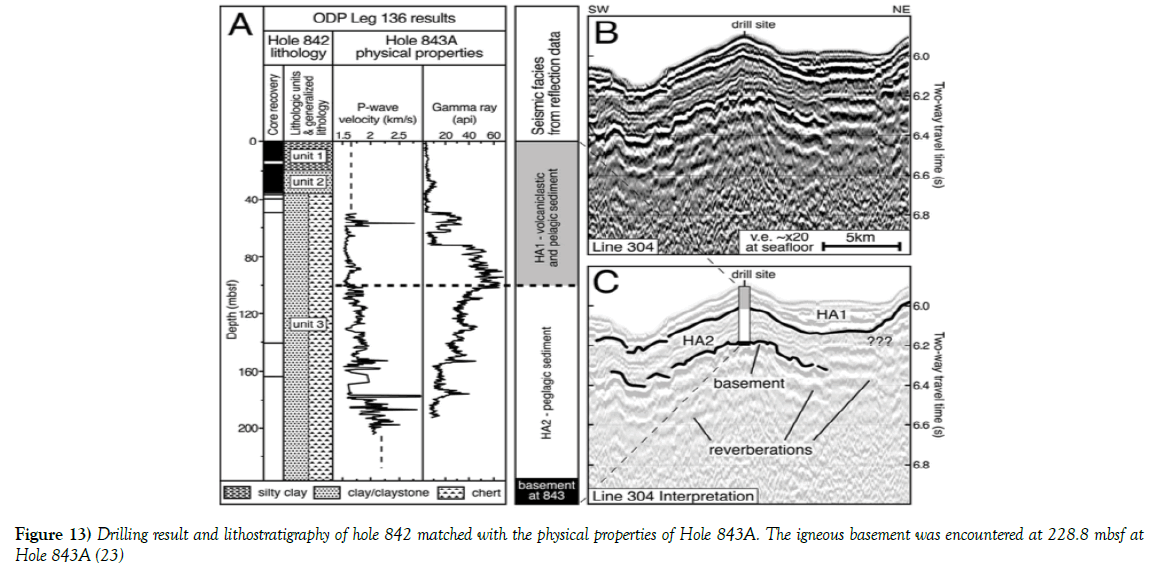
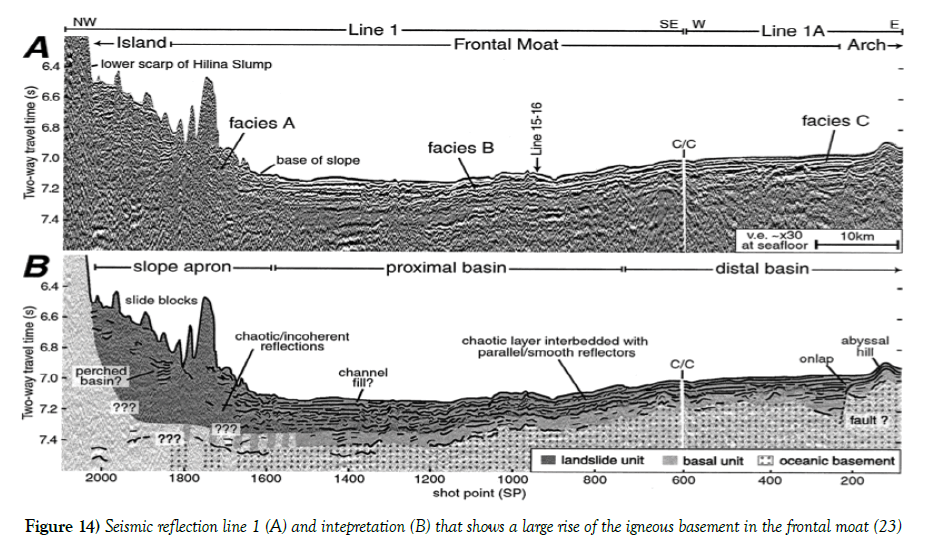
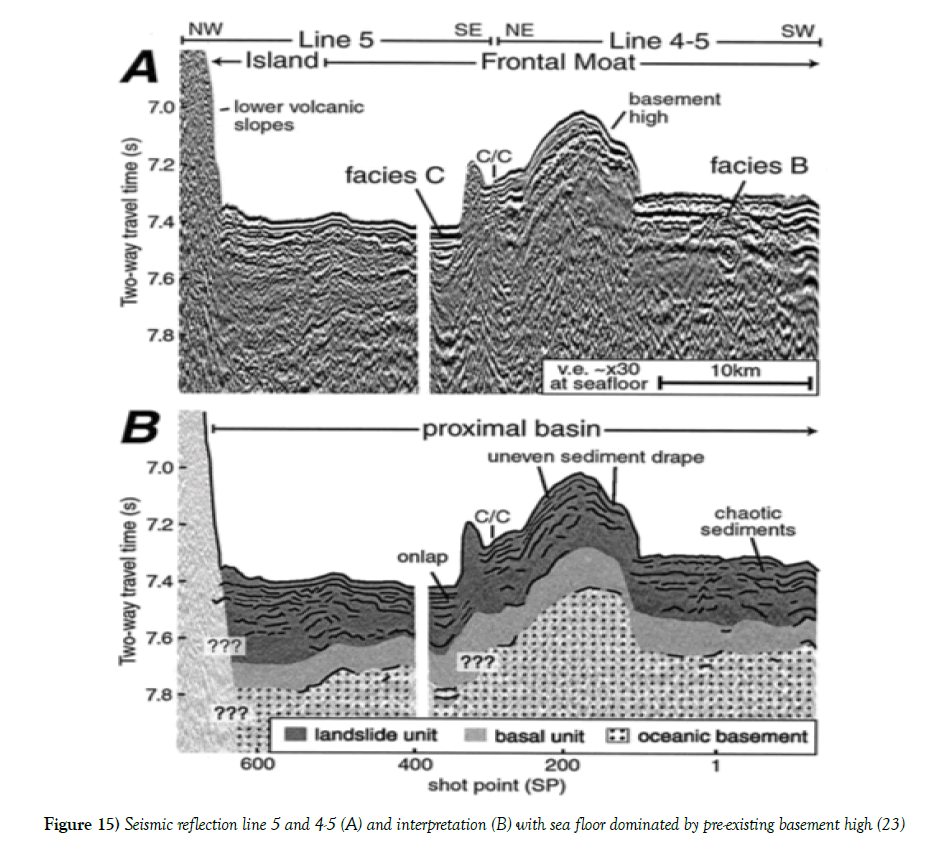
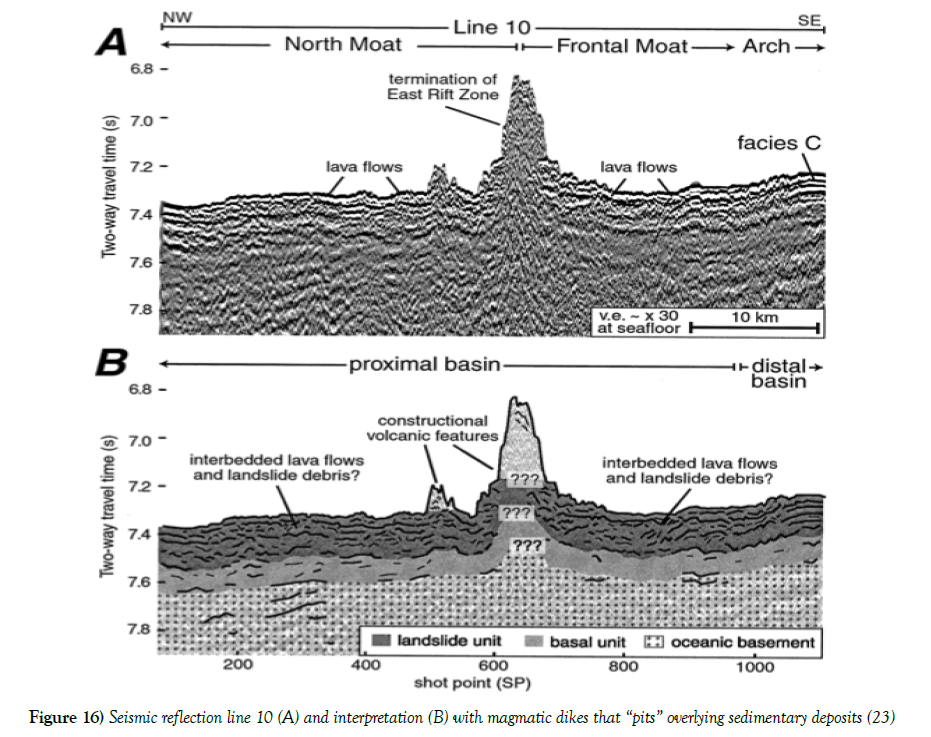
The interpretation of the subsequent seismic data, extracted from the work of Leslie SC et al. allow defining some important considerations. Firstly, drilling carried out at the hole 843A [seismic line 304] indicates the presence of the igneous basement at 228.8 mbsf (Figure 13). Line 1 show that below the FHM sediments, consisting of chaotic reflectors due to debris flow, there is a large rise of the basement (Figure 14). The 4-5 FHM seismic lines also shows a sedimentary facies that forms a high structural in response to a pronounced rise of the basement (Figure 15). Line 10, located in one of the areas with a high density of pockmark stars, shows that the uplift of the igneous basement “pits” overlying sedimentary deposits generating several magmatic dikes and lava streams inside them (Figure 16). Seismic profiles confirm the existence of a region characterized by a high topography of the basement due to seamount of the Cretaceous age with heights from hundreds to thousands of meters above the surrounding sea beds [26].
Figure 13: Drilling result and lithostratigraphy of hole 842 matched with the physical properties of Hole 843A. The igneous basement was encountered at 228.8 mbsf at Hole 843A [23]
Figure 14: Seismic reflection line 1 (A) and intepretation (B) that shows a large rise of the igneous basement in the frontal moat [23]
Figure 15: Seismic reflection line 5 and 4-5 (A) and interpretation (B) with sea floor dominated by pre-existing basement high [23]
Figure 16: Seismic reflection line 10 (A) and interpretation (B) with magmatic dikes that “pits” overlying sedimentary deposits [23]
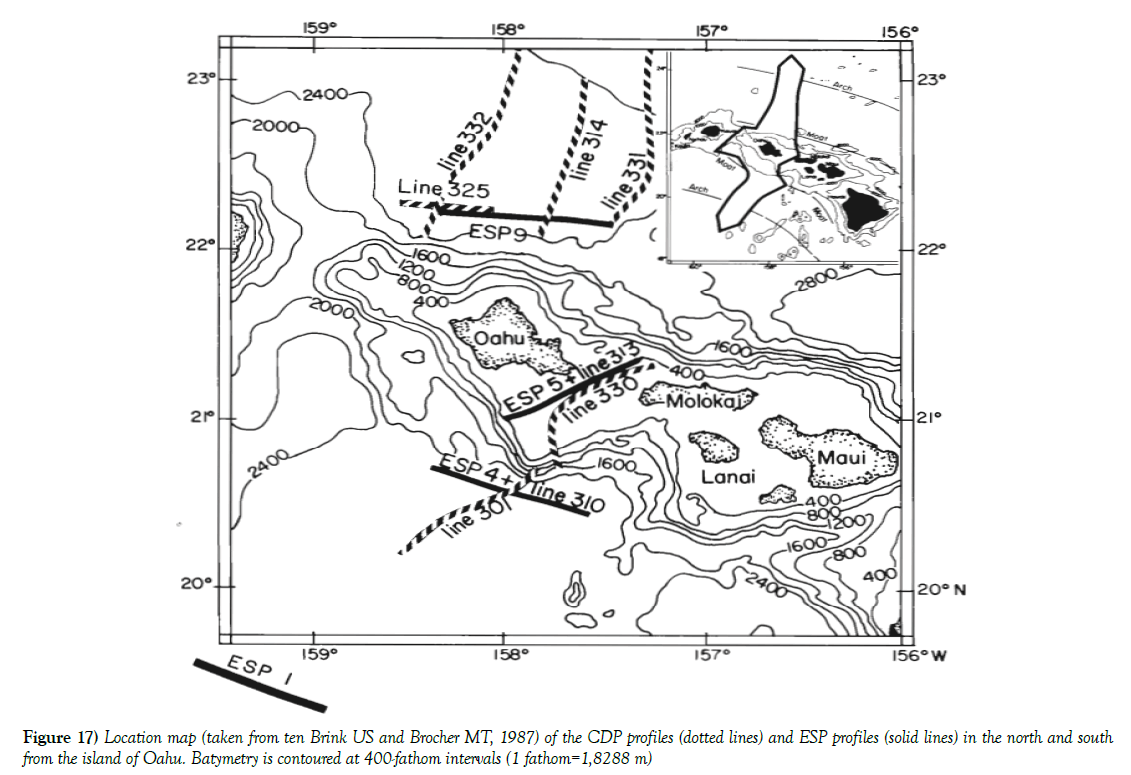
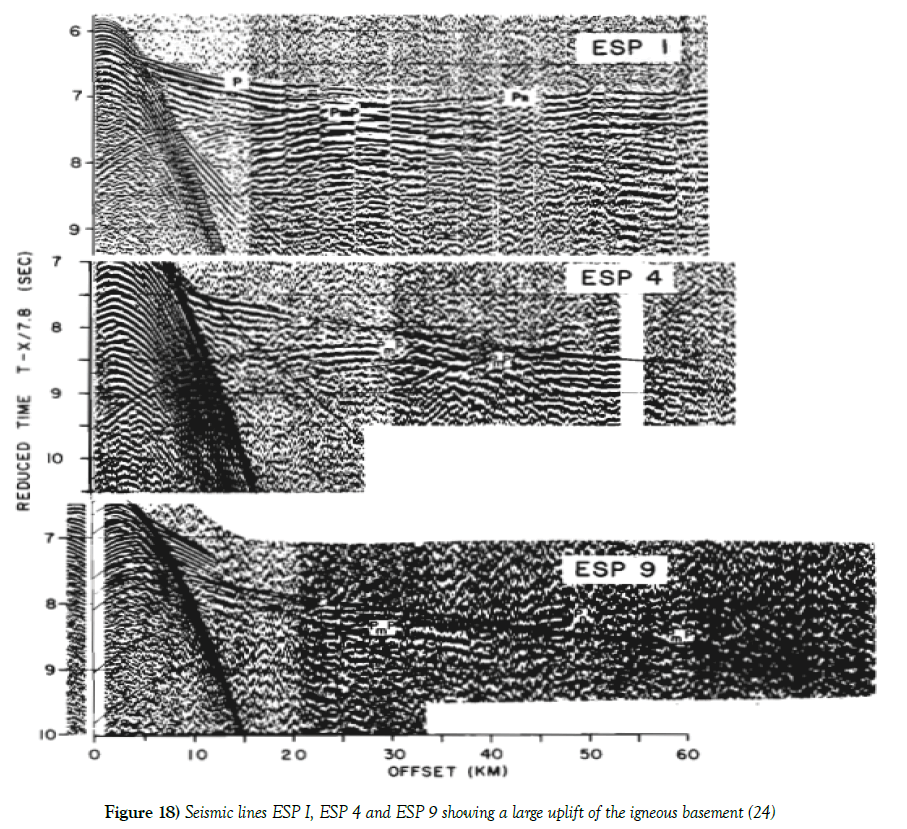
In simmetric way, seismic data extracted from the work of ten Brink US and Brocher MT, were analyzed. Multichannel seismic refraction profiles [ESPS] and coincident and crossing large-aperture multichannel reflection profiles extend to the north and south from the island of Oahu (Figure 17) shows uplift of the igneous basament with respect to the surrounding seabeds. In Figure 18 the records obtained using explosive source for seismic line ESP I [located on normal oceanic crust, south of Ohau] compared with the ESP 4 and ESP 9 profiles made in the flexural moats [north and south of the islands] show a rise of the deep basament.
Figure 18: Seismic lines ESP I, ESP 4 and ESP 9 showing a large uplift of the igneous basement [24]
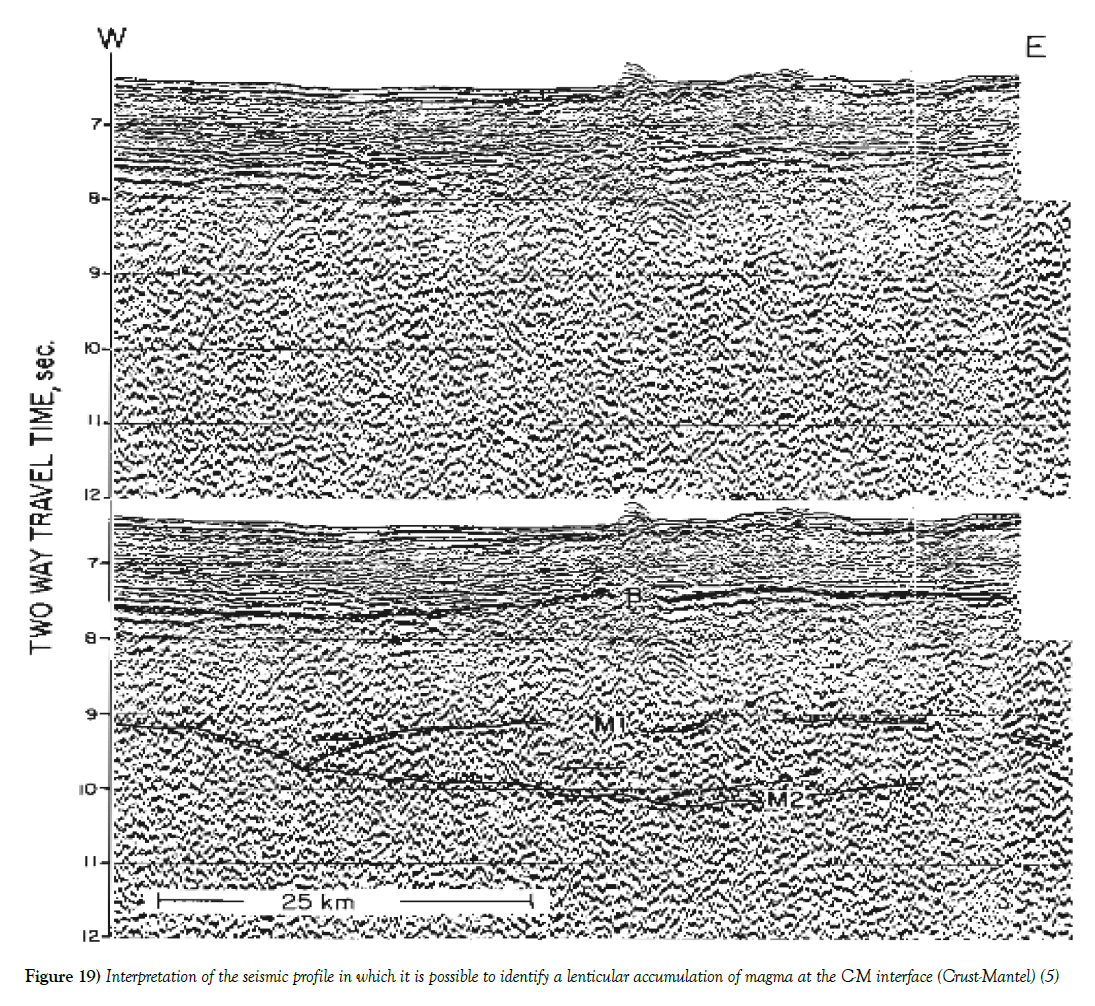
The interpretation of seismic data appears to be in agreement with the presence of highs structural linked with the uplift of the igneous basement confined within the crust or, in other cases, emerging into the seabed in the form of seamounts and/or volcanic dikes. In Figure 19 evidence of underplating magmatism with M1 and M2 bounding a lenticular shape at the crust-mantle interface. It should be noted that the reflectors placed above show a drape probably due to the underlying lenticular accumulation of magma.
Figure 19: Interpretation of the seismic profile in which it is possible to identify a lenticular accumulation of magma at the C-M interface (Crust-Mantel) [5]
Pockmark stars in the world
There are several examples of pockmark stars in the world both in continental areas and at ocean islands. The size of the stars is quite heterogeneous with arms varying from 20 km to 8 km and their regularity is often altered, for subaerial forms, by erosion of exogenous agents. Frequently pockmark stars appear in groups and their geometry, more or less symmetrical, depends on several factors:
• Dimensions: larger stars tend to reduce their symmetry and number of arms (usually three arranged at 120 degrees from one another);
• Homogeneity of the medium: in a heterogeneous medium, the development of the stars arms tends to be irregular.
Even the rock type and the features of the deep source influence the greater or less symmetry of the stars. Only some of the innumerable structures identified in continental areas and in the oceanic islands are reported.
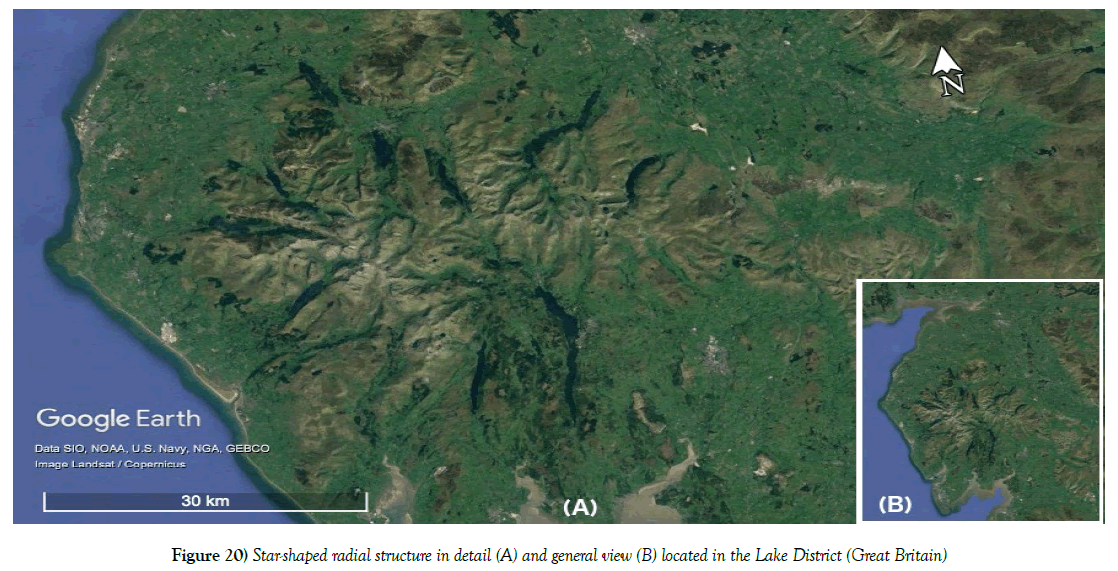
Cumbria lake district, United KingdomIn Britain, in the Lake District, there is a radial structure (Figure 20) formed by super volcanoes of about 450 million years old where the lakes radiate outwards from the central, highest mountains, like the spokes of a wheel [27]. The average length of the arms is about 20 km. In the same area there are other super volcanoes such as Snowdonia and Edinburgh: in some of them you can observe some wrecks of the original star structure.
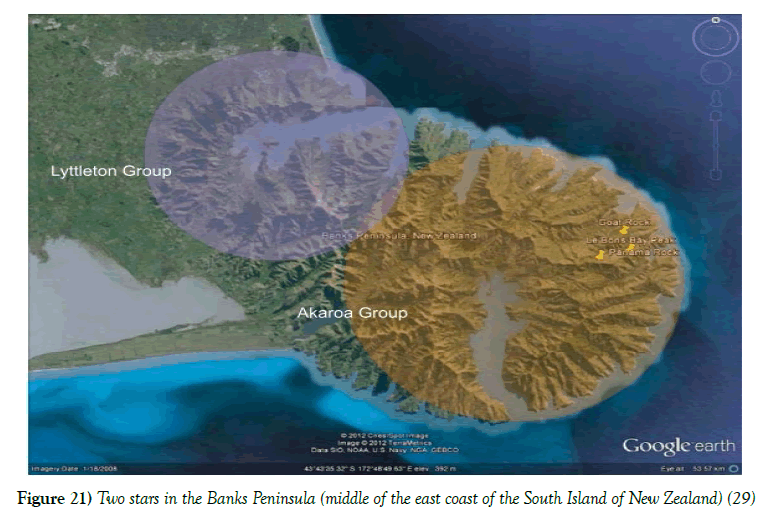
Banks Peninsula is an entirely volcanic unit closest to the city of Christchurch on the middle of the east coast of the South Island of New Zealand. The flat morphology of the inner areas is interrupted by the presence of sea-stars morphology. It is comprised of two eruptive centers: the Lyttleton group [10.6-12.4 Ma] on the northwestern side and the Akaroa group [8.8-9.4 Ma] on the southeastern side. The image in Figure 21, taken from the work of Tramontano S, 2012, highlights with different colors the sectors colonized by the two neighboring stars. These formed due to intraplate volcanism between approximately eleven and eight million years ago (Miocene) on a continental crust [28,29].
Figure 21: Two stars in the Banks Peninsula (middle of the east coast of the South Island of New Zealand) [29]
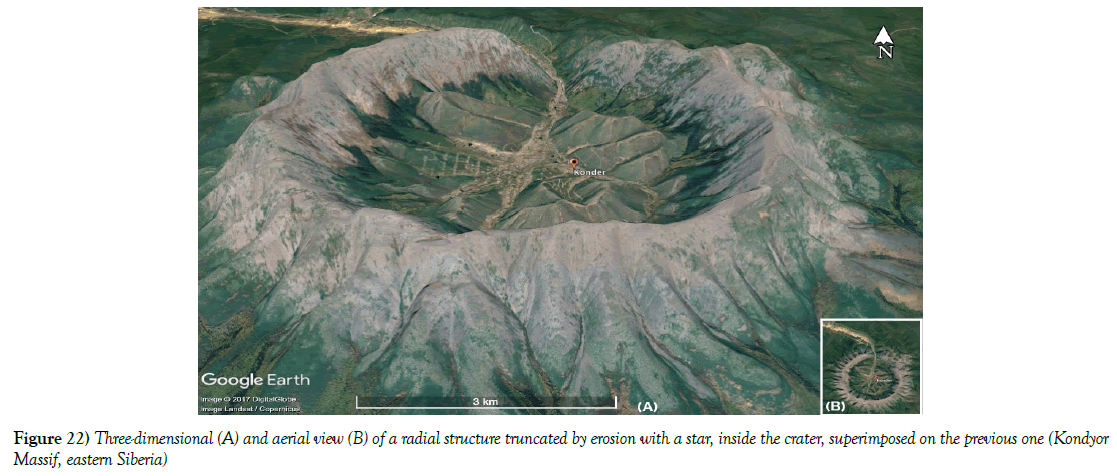
In eastern Siberia, a perfect circle of rock contrasts with the surrounding topography. The 6 kilometer [3.7 mile] wide ring looks like an impact crater, or the caldera of an extinct volcano, but it is neither. Kondyor Massif was formed by the intrusion of igneous, or volcanic, rock that pushed up through overlying layers of sedimentary rock, some of them laid down more than a billion years ago [30]. Note the classic radial structure truncated by erosion with a star, inside the crater, superimposed on the previous one (Figure 22).
In New Mexico there is a sequence of intrusive rocks due to different volcanic fields: Raton-Clayton and Taos Plateau volcanic fields are some of them.
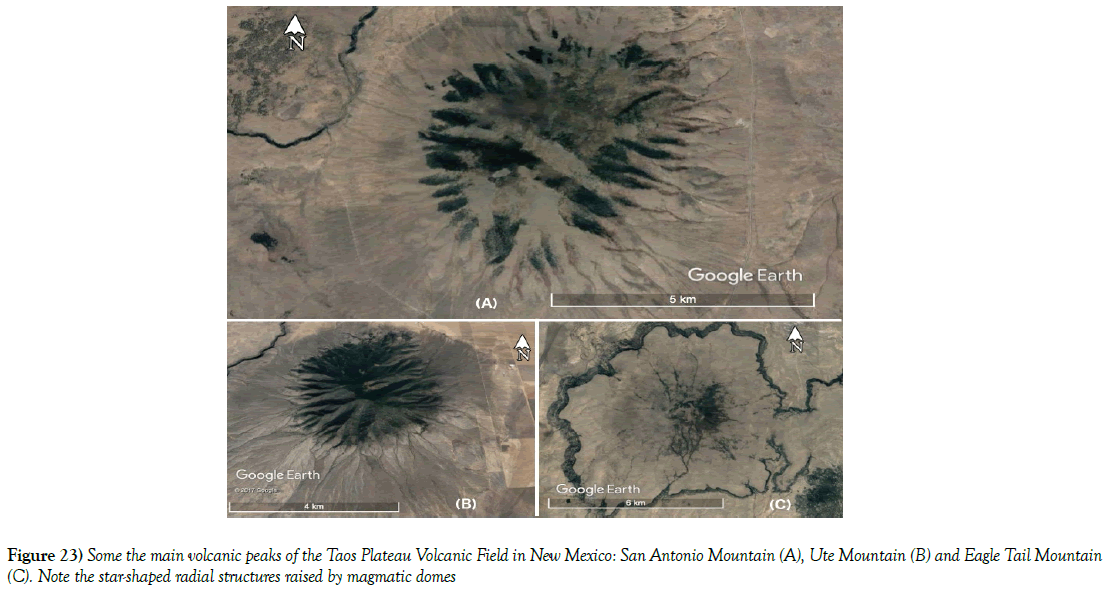
The Taos Plateau volcanic field is an area of extensive volcanism in Taos County, New Mexico. The composition of the lavas varies from tholeiitic basalt to rhyolite and the main volcanic peaks are: San Antonio Mountain, Ute Mountain, Cerro de la Olla, Cerro del Aire, Cerro Chiflo, Guadalupe Mountain North, Guadalupe Mountain South, Cerro Montoso [31]. All volcanic peaks, of heterogeneous dimensions, have radial structures and are located a short distance from each other (Figure 23).
The Raton-Clayton is an extinct volcanic field that is thought to be formed by the Raton hotspot [32]. Again, there are several plumes with radial structure, such as Sierra Grande. The Eagle Tail Mountain has generated a small size star with arm’s length of about 3 km and quite outlined.
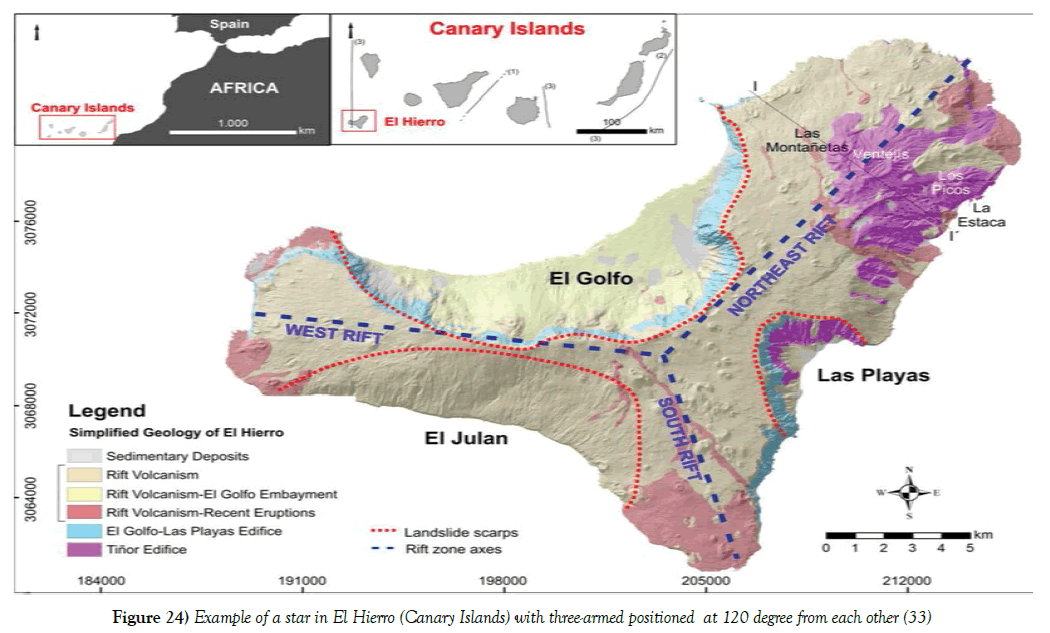
Canary islandsIn the island of El Hierro [Canary Islands], characteristic radial distribution of structural elements such as dykes and eruptive fissures, are shown in Figure 24, taken from Becerril L et al. It suggests the existence of a rather uniform stress field during the constructive episodes that was maintained during the growth of the whole island. Furthermore, a local stress field would be generated which would have conditioned the propagation of new intrusions, thus giving a false impression of the existence of a deep-seated three-armed rift system on El Hierro [33].
Figure 24: Example of a star in El Hierro (Canary Islands) with three-armed positioned at 120 degree from each other [33]
The average length of the arms, positioned at 120 degrees from each other, is 15 km.
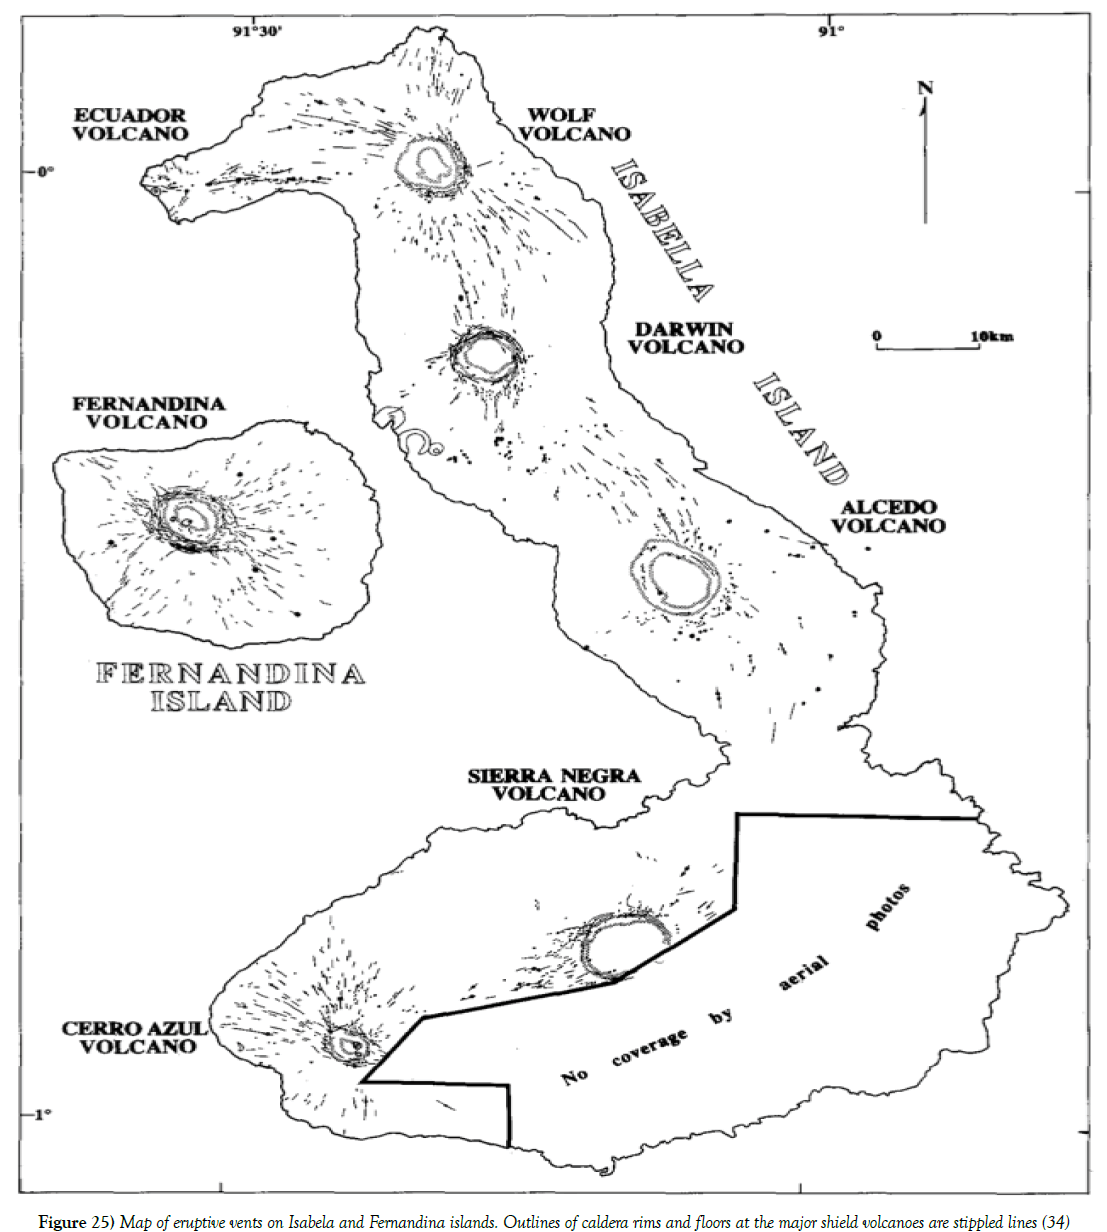
Galapagos islandsPattern that consists of circumferential eruptive fissures around the summit calderas and radial fissures lower on the flanks of Fernandina and Isabela islands show that either circumferential or radial eruptions have been dominant in recent time [34]. In Figure 25, taken from Chadwick WW and Howard KA, the structural features of the volcanoes in the island of Isabela show a series of stars developed a short distance from the other with an average length of arms of about 12 km, while on the island of Fernandina there is a continuation of the radial structures at sea where they form submarine ridges.
Figure 25: Map of eruptive vents on Isabela and Fernandina islands. Outlines of caldera rims and floors at the major shield volcanoes are stippled lines [34]
The Cape Verde Archipelago, is a group of islands situated in the North Atlantic to 450–600 km off the western coast of Africa and constitute an archipelago generated by Neogene oceanic hotspot volcanism.
On the islands Santa Luzia and Sao Nicolau there are active rifting phenomena: in the island of Sao Vicente it is possible to identify three star arms, also characterized by active rifting, arranged at 120 degrees from each other with an average arm length of about 8 km. This structure is shown in Figure 26, taken from Ancochea E et al.
Figure 26: A view of the Santa Luzia, Sao Nicolau and Sao Vicente islands (Cape Verde Archipelago). Note that is possible to identify active rifting phenomena with three star arms disposed at 120 degrees from each other [36]
A basic radial dike swarm unrelated to other basic units of Boa Vista has been localized and characterized in the central sector of the island [35,36].
Discussion
Special radial structures formed by coalescent pockmark alignment have been found, for the first time, in the south-eastern offshore of Hawaii Island in a total area of about 50,000 km2 (Figure 1). These forms pockmarks-based, generally has a high degree of symmetry, but in some cases their regularity is obliterated by the conformation of the seabed. The extreme similarity of the morphological and morphometric features of most of the stars class can be attributed to the same deep source whose dynamics have fed and produced radial shapes in the bottom of the sea. Frequently pockmark stars have a lifted central part with respect to development of the arms and, in some cases, can be seen a pronounced dome.
Through the analysis and the interpretation of several seismic lines in the oceanic areas surrounding the Hawaiian Islands it was possible to formulate hypotheses on the genesis of these particular structures.
The absence of an anomaly heatflow beneath the Hawaiian Islands makes it unlikely a thermal origin for Hawaiian swelling. According to the classic theory, scientists believe that a plume coming from the mantle, near the lithosphere, is deflected by generating a thin parabolic “pancake” beneath the overriding plate [1] that generates an elongated, parabolically shaped swelling of seafloor topography [37]. Ballmer MD et al. [2], based on recent high-resolution seismic tomography, observe a wide low-velocity body in the upper mantle below the Hawaiian swell with pronounced small-scale variability. To explain the asymmetric variations in the density of the mantle and topography swell between the Northeast and Southeast Hawaii Island, they invoke two small-scale convections located respectively in the ambient mantle and within the spreading plume. The first can erode the base of the lithosphere, creating washboard topography on the underside of the plate and the second generating localized zones of upwelling well away from the hotspot.
Seismic reflection and refraction data, already in the past, have highlighted the existence of an abnormal thickness of the transition zone C-M [about 3-6 Km] extending in a 200-km-wide area centered at Ohau island, in accordance with the previous petrologic models involving accumulation of upwelling magma at and below the Moho (Figure 19). The existence of such a large volume of intrusions near the base of the crust [magmatic underplating] implies that the superficial expression of volcanism constitutes only a small fraction of the amount of melt generated at depth under the Hawaiian Islands [5]. In the same work is highlighted that much of the Hawaiian swell is underplated whereas a lack of underplating beneath the moat surrounding the island of Hawaii suggests that underplated crust outward of the moat has been fed from below by dykes through the lithosphere rather than by sills spreading from the current locus of volcanism.
Seismic images of Hawaiian Frontal Moat [FHM] and seismic profiles of oceanic areas, in the north and south of Oahu Island, show small plumes, magmatic peaks, seamounts and other similar structures. These phenomena are related to local seabed elevations due to rising of the igneous basement of cretaceous age.
The existence of significant rising of the igneous basament, highlighted by the analysis of seismic profiles and the presence of topographic highs of magmatic origin [seamount, lavic domes] placed at the symmetry center of the stars denote an endogenous origin for these radial structures. But the results obtained from the calculation of the Pearson correlation coefficient [r = 0.014] for the two variables [average length of the arms and topographic gradient of the axial zone], seem to exclude that the development of stars is linked to the active push of a magmatic plum rising upwards: in this case, as the lifting gradients of the axial area increase, there should be an increase in the length of the star arms and vice versa. The absence of a linear relationship between these two parameters shows that topographical highs are linked to a secondary mechanism with respect to the one that originally created the perfectly symmetrical structure of the stars. Frequently the small lava plumes show to disturb pre-existing structures by lifting and, in some cases, displacing entire portions of pockmark stars.
Conclusion
Our experimental and empirical analysis reveals that the structures seastarshaped, discovered in the seabed near the Hawaii islands, is attributable to small magma intrusions that lifting limited portions of the seabed and generates a field of radial fractures through which gases and liquids can penetrate by generating superficial hemispherical forms. In some cases the central area of the star maintains a flat or depressed morphology, while in other cases magma reaches the surface fractures by generating fissure eruptions covering the pre-existent radial structures and developing magmatic peaks and/or seamounts in the seabed.
The alternate presence of depressions or domes in the central part of the stars, their morphological similarity, and the dimensional variability of stars may indicate the existence of a similar impulse source characterized by a variable intensity of deep inputs [magma plumes]. According to the asymmetrical variations of both mantle density and the swell topography about the islands, small plumes could be related to magmatic intrusions from the lithosphere.
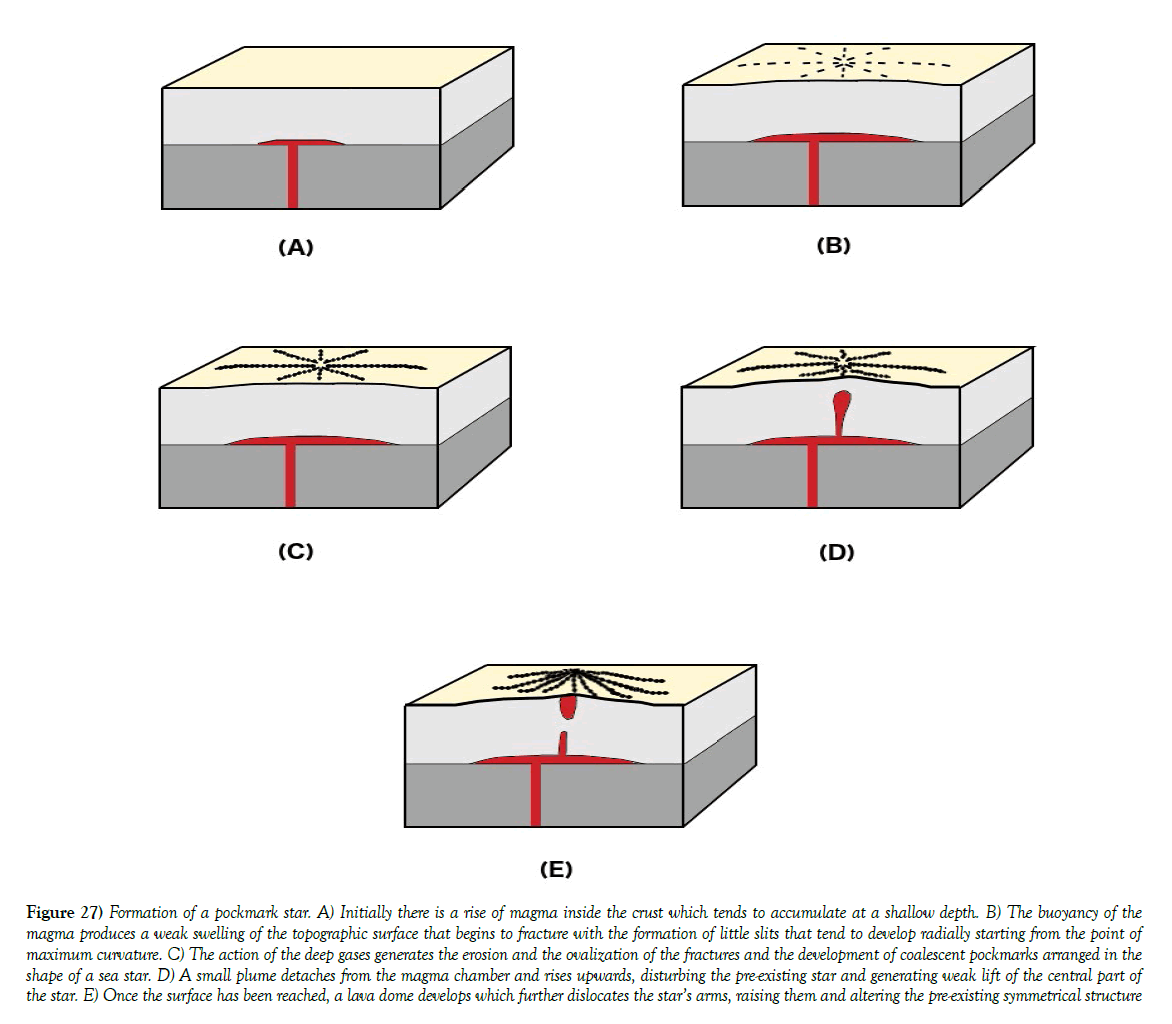
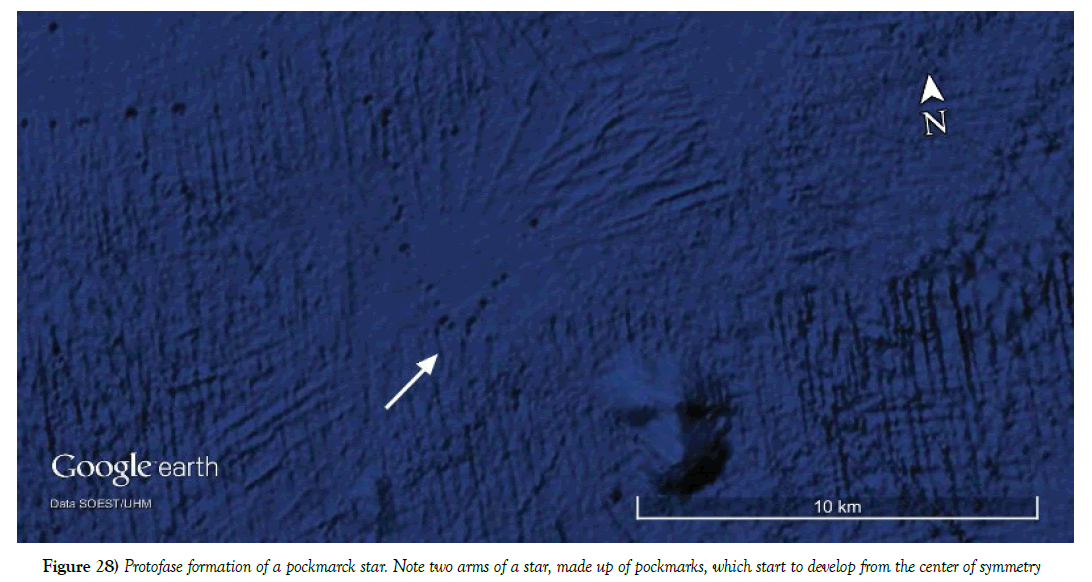
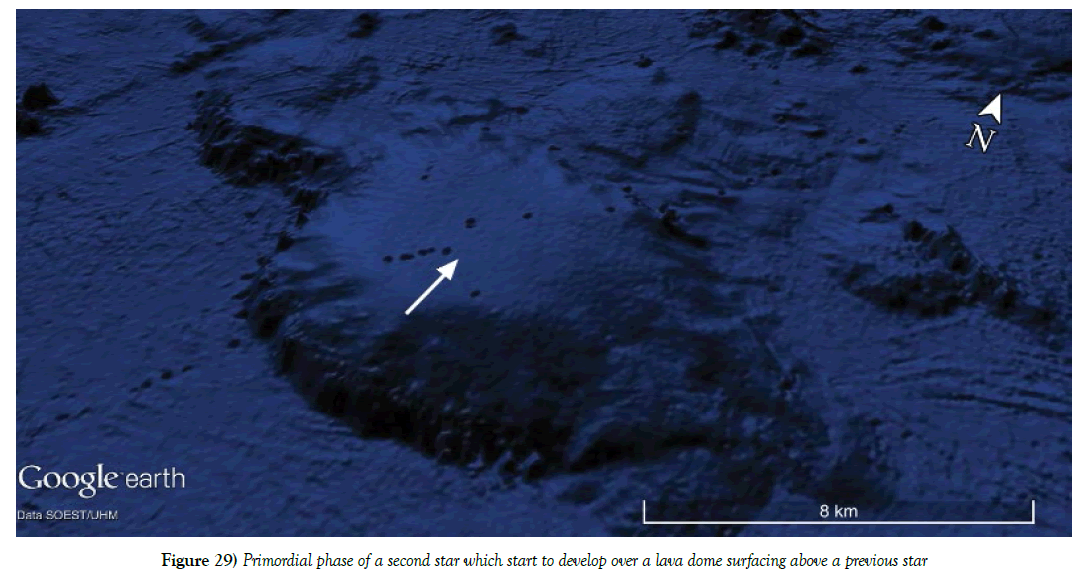
The absence of correlation between the raising of the axial area and the progradation of the stars arms makes it possible to suppose that the perfect symmetry of the stars, present in the seabed surrounding the Hawaiian islands, is related to weak swellings of small portions of the seabed due to the thrust of buoyancy small portions of magma that are stationed at low depths (Figures 27A and 27B). The weak slope of the oceanic crust creates limited surface stresses that generate a series of cracks, initially located at a certain distance from each other and arranged radially starting from the point of maximum curvature of the superficial swelling (Figure 27C). The pressure falls from fracturing promotes the rise of deep gases which, coming out of the slits, tend to widen them. The erosion on the walls associated with sinking ovalizes the discontinuities generating the classic pockmarks; the evolution of this mechanism will lead to an approach of these hemispheric morphologies up to a marked coalescence (Figure 27D). This first phase of the model is found in all the observed stars and in some of them it is particularly evident (Figure 8). In some sectors of the Hawaiian offshore it is possible to recognize the primordial phase of the birth of a star with pockmarks that begin to develop radially from the future center of symmetry (Figure 28). The evolution of this first mechanism leads to the formation of perfectly flat stars or characterized by a very weak slope: about 39% of the stars found by satellite observations are the product and the testimony of this first phase. In some cases, favorable physical-chemical conditions can be created so that the magma, stagnant within the crust, can rise and perturb the previously created pockmark star. In this way the shape of the star will be disrupted by dislocations of its arms, by creation of topographic gradients [lava domes, seamount] perfectly in axis or, in other cases, eccentric with respect to the center of symmetry of the star (Figure 27E). In other cases seamount pronounced will be formed whose effusive activity may partially cover (Figure 5A) or totally the pre-existing stars. The absence of correlation can therefore be interpreted as the superimposition of this second mechanism, which creates pronounced topographic gradients, to the previous genetically responsible for the development of the star arms. The same mechanisms can be repeated cyclically, creating superpositions of one star on top of the other (Figure 9A). Similarly to the previous case, examples have been found to prove this statement in Figure 29 it is possible to observe the primordial phase of a second star which tries to develop over a lava dome surfacing above a previous star.
Figure 27: Formation of a pockmark star. A) Initially there is a rise of magma inside the crust which tends to accumulate at a shallow depth. B) The buoyancy of the magma produces a weak swelling of the topographic surface that begins to fracture with the formation of little slits that tend to develop radially starting from the point of maximum curvature. C) The action of the deep gases generates the erosion and the ovalization of the fractures and the development of coalescent pockmarks arranged in the shape of a sea star. D) A small plume detaches from the magma chamber and rises upwards, disturbing the pre-existing star and generating weak lift of the central part of the star. E) Once the surface has been reached, a lava dome develops which further dislocates the star’s arms, raising them and altering the pre-existing symmetrical structure
Similar structures to those found on the Hawaiian Islands have also been identified in other parts of the world: some of them have been described in previous pages. In almost all cases, star-shaped structures have been found in crustal areas characterized by magmatic underplating [Cape Verde Archipelago, Galapagos Islands, Canary Islands, Volcanic Fields in New Mexico, Banks Peninsula and Cumbria Lake District] and in some cases are grouped together a short distance with obvious interactions between nearby radial structures [Banks Peninsula, Kondyor Massif and Volcanic Fields in New Mexico].
Overall the radial structures found in the seabeds surrounding the Hawaiian Islands and their genetic mechanisms could provide useful indications to understand the dynamics associated with the corresponding large-scale structures created by magmatic underplating.
For supplementary information about pockmark stars with a full image collection, visit:
https://www.slideshare.net/secret/yyiU44ZxdKC3O6
REFERENCES
- Morgan WJ. Convection plumes in the lower mantle. Nature 1971;230:42–43.
- Ballmer MD, Ito G, van Hunen J, et al. Spatial and temporal variability in Hawaiian hotspot volcanism induced by small- scale convection. Nature Geoscience 2011.
- Watts AB, Ten Brin US, Buhl P, et al. A multichannel seismic study of lithospheric flexure across the Hawaiian-Emperor seamount chain. Nature 1985;315:105-111.
- Lindwall DA. A two-dimensional seismic investigation of crustal structure under the Hawaiian Islands near Oahu and Kauai. J Geophys Res 1988;93:12107-22.
- Ten Brink US, Brocher TM. Multichannel seismic evidence for a subcrustal intrusive complex under Oahu and a model for Hawaiian volcanism. J Geophys Res 1987;92(13):13687–707.
- Garrett M, Collins JA, Wolfe JC, et al. Underplating of the Hawaiian Swell: evidence from teleseismic receiver functions. Geophysical Journal International 2010;183(1):313–29.
- Wanless DV, Garcia MO, Trusdell FA, et al. Submarine radial vents on Mauna Loa Volcano, Hawaii. Geochem Geophys Geosyst 2006;7(5).
- Lockwood J P, Lipman PV. Holocene eruptive history of Mauna Loa Volcano. US Geol Surv 1987;1350:509–35.
- Yokoyama I. Eruption patterns of parasitic volcanoes. Annals of Geophysics 2015;58( 3):S0327.
- Solheim A, Elverhøi A. A pockmark field in the Central Barents Sea; gas from a petrogenic source? Polar Res 1985;3:11–19.
- García M, Ercilla G, Alonso B. Morphology and sedimentary systems in the Central Bransfield Basin, Antarctic Peninsula: sedimentary dynamics from shelf to basin. Basin Res 2009;21: 295–314.
- Betzler C, Lindhorst S, Hübscher C, et al. Giant pockmarks in a carbonate platform (Maldives, Indian Ocean). Marine Geology 2011;289:1–16.
- Rollet N, Logan GA, Kennard JM, et al. Characterization and correlation of active hydrocarbon seepage using geophysical data sets: An example from the tropical, carbonate Yampi Shelf, Northwest Australia. Mar Petrol Geol 2006;23:145–64.
- Pilcher R, Argent J. Mega-pockmarks and linear pockmark trains on the West African continental margin. Mar Geol 2007;244:15–32.
- Fader GBJ. Gas-related sedimentary features from the eastern Canadian continental shelf. Cont Shelf Res 1991;11:1123–54.
- Whiticar M, Werner F. Pockmarks: Submarine vents of natural gas or freshwater seeps? Geo-Mar Lett 1981;1:193-9.
- Kvenvolden KA, Cooper CK. Natural seepage of crude oil into the marine environment. Geo-Marine Letters 2003;23:140-6.
- Kvenvolden KA. Methane hydrates – A major reservoir of carbon in the shallow geosphere? Chem Geol 1988;71:41-51.
- Webb KE. Ecology and geology of pockmarks. Dissertation for the degree of Philosophiae Doctor, Department of Biology, University of Oslo. 2009.
- Thrush SF, Dayton PK. Disturbance to marine benthic habitats by trawling and dredging: Implications for marine biodiversity. Annu Rev Ecol Syst 2002;33:449-73.
- Thrush SF, Gray JS, Hewitt JE, et al. Predicting the effects of habitat homogenization on marine biodiversity. Ecol Appl 2006;16:1636-42.
- Ryan WBF, Carbotte SM, Coplan J, et al. Global Multi-Resolution Topography (GMRT) synthesis data set. Geochem Geophys Geosyst 2009;10:Q03014.
- Leslie SC, Moore GF, Morgan JK, et al. Seismic stratigraphy of the Frontal Hawaiian Moat: implications for sedimentary processes at the leading edge of an oceanic hotspot trace. Marine Geology 2002;184:143-62.
- Ten Brink US, Watts AB. Seismic stratigraphy of the flexural moat flanking the Hawaiian Islands. Nature 1985;317:421-4.
- Rees BA, Detrick RS, Coakley BJ. Seismic stratigraphy of the Hawaiian flexural moat. Geol Soc Am Bull 1993;105:189-205.
- Moore JG, Chadwick WW. Offshore geology of Mauna Loa and adjacent areas, Hawaii. In: Rhodes JM, Lockwood JP, eds. Mauna Loa revealed: Structure, Composition, History, and Hazards. Geophys. Monograph 1995;92:21-44.
- Moss B. Ecology of Fresh Waters: A View for the Twenty-First Century. Wiley-Blackwell, Fourth Edition 2010.
- Timm C, Hoernle K, Van Den Bogaard P, et al. Geochemical Evolution of Intraplate Volcanism at Banks Peninsula, New Zealand: Interaction Between Asthenospheric and Lithospheric Melts. Journal of Petrology 2009;50(6):989-1023.
- Tramontano S. Reconstructing the Magmatic History of Goat Rock Intrusive, Banks Peninsula 2012. (Unpublished manuscript.)
- Shcheka GG, Lehmann B, Gierth E, et al. Macrocrystals of Pt–Fe alloy from the Kondyor pge placer deposit, Khabarovskiy Kray, Russia: trace-element content, mineral inclusions and reaction assemblages. The Canadian Mineralogist 2004;42:601-17.
- Lipman PW, Mehnert HH. The Taos Plateau Volcanic Field, Northern Rio Grande Rift, New Mexico, in Rio Grande Rift: Tectonics and Magmatism. American Geophysical Union. 1979.
- Aubele JC, Crumpler LS. Raton-Clayton and Ocaté volcanic fields. New Mexico Geological Society 52nd Field Conference Guidebook 2001:69-76.
- Becerril L, Galindo I, Martí J, et al. Three-armed rifts or masked radial pattern of eruptive fissures? The intriguing case of El Hierro volcano (Canary islands). Tectonophysics 2015:647-8.
- Chadwick WW, Howard KA. The pattern of circumferential and radial eruptive fissures on the volcanoes of Fernandina and Isabela islands, Galapagos Bull Volcanol 1991;53:259–75.
- Ancochea E, Hernán F, Huertas MJ, et al. A basic radial dike swarm of Boa Vista (Cape Verde Archipelago); its significance in the evolution of the island. J Volcanol Geoth Res 2012;243:24–37.
- Ancochea E, Hernán F, Huertas MJ, et al. Structure, composition and age of the small islands of Santa Luzia, Branco and Raso (Cape Verde Archipelago). Journal of Volcanology and Geothermal Research 2015;302:257-72.
- Zhong SJ, Watts AB. Constraints on the dynamics of mantle plumes from uplift of the Hawaiian Islands. Earth Planet Sci Lett 2002;203:105–16.


