Small molecule PD1 and PDL1 inhibitors
Received: 14-Feb-2023, Manuscript No. puljnn-23-6162; Editor assigned: 17-Feb-2023, Pre QC No. puljnn-23-6162 (PQ); Accepted Date: Mar 25, 2023; Reviewed: 24-Feb-2023 QC No. puljnn-23-6162 (Q); Revised: 10-Mar-2023, Manuscript No. puljnn-23-6162 (R); Published: 30-Mar-2023, DOI: 10.37532/puljnn.2023.7(1).1-8.
Citation: Ji HF, Zaman R, Xu J. et al. Small molecule PD1 and PDL1 inhibitors. J Nanosci Nanomed 2023; 7(1): 01-08.
This open-access article is distributed under the terms of the Creative Commons Attribution Non-Commercial License (CC BY-NC) (http://creativecommons.org/licenses/by-nc/4.0/), which permits reuse, distribution and reproduction of the article, provided that the original work is properly cited and the reuse is restricted to noncommercial purposes. For commercial reuse, contact reprints@pulsus.com
Abstract
A very limited number of small molecule inhibitors targeting PD1/PDL1 signaling pathway have entered clinical trials at this point. We investigated several ligand databases against PD1 and PDL1 separately to evaluate their prospects as potential small molecule PD1/PDL1 inhibitors. Computational studies showed promising results for our hit compounds and some of which are commercially available as well. Three potential small molecule inhibitors for each of PD1 and PDL1 enzyme have been identified based on our structure based virtual screening of ZINC15 ligand database. Proteinligand interactions between our hit compounds and their corresponding target receptors have been analyzed using relevant software which indicates significant binding affinity due formation of hydrogen bond and van der Waals interactions. Predicted ADME properties of all hit compounds have also been determined using online tools. In addition, molecular dynamics simulation has also been performed at one nanosecond to investigate the conformational stability of the protein-ligand complex using GROMACS software. The Root Mean Square Deviation (RMSD) for protein and ligand and Root Mean Square Fluctuation (RMSF) of the protein residues at C-alpha position indicate fair stability
Key Words
Inhibitors; Immuno-inhibitory receptors; Molecular docking; Malignancies
Introduction
Programmed cell death-1 receptor (PD-1) is an immune inhibitory receptor which is expressed in activated T-cells [1-3]. Programmed Cell Death Ligand 1 (PD-L1) is the natural ligand of PD-1 which can engage with PD-1 and is important for maintaining central and peripheral T cell tolerance [4, 5]. Overexpression of PDL1 in different types of tumor cells in the tumor microenvironment enables the cancerous cells to evade the host immune system [6-9]. The interaction between PDL1 and PD1 has been reported to be influential not only in cancer but also in chronic viral infection and autoimmune disorders [10-13]. PD1/PDL1 interaction causes conformational change in PD-1 which results in the phosphorylation of the cytoplasmic Immunoreceptor Tyrosine-Based Inhibitory Motif (ITIM) and the Immunoreceptor Tyrosine-Based Switch Motif (ITSM) by Src family kinases [14, 15]. This incident subsequently attenuates T cell-activating signals. Thus, the PD1/PDL1 pathway helps to prevent over stimulation of immune response and maintains the immune tolerance to self-antigens by negatively regulating it. It has been reported that PD1 is upregulated in cancer specific T-cells, while PDL1 is overexpressed in various types of human tumors [16]. Malignancies like cancer and HIV specific T-cells are believed to use this PD1/PDL1 pathway to evade body’s immune system by inducing local immune suppression [17-19]. It has been suggested by several researchers that manipulating PD1/PDL1 pathway using inhibitors may be a competent strategy to treat different types of cancers and viral infections including HIV and SIV induced infections [20-23]. Multiple publications reported that blocking the interactions of PD1 and or PDL1 using Monoclonal Antibodies (mAbs) show promising antitumor activities in different phases of clinical trials among human patients [24-29]. So far, six mAbs have been approved by the US Food and Drug Administration (FDA) since 2011 to treat different types of cancers [30]. However, antibody therapy to block PD1/PDL1 pathway comes with several disadvantages. Inflammatory side effects or Immune Related Adverse Events (irAEs), poor tissue and tumor penetration, low oral bioavailability, immunogenicity and high production costs are some of the undesired characteristics of antibody therapy [31, 32]. To address these shortcomings, small molecule PD1/PDL1 inhibitors are being actively sought after by academicians and pharmaceutical companies as small molecule inhibitors have better tissue and tumor permeability, oral bioavailability, and shorter half-lives [33, 34]. Thus, the development of small molecule inhibitors for the PD1/PDL1 pathway has huge research and application prospects. Developing small molecule inhibitors to block PD1/PDL1 pathway is in urgent need. We believe through computational studies that some small molecule inhibitors could be successfully discovered to treat cancer and chronic viral infections. Since the approval of the first monoclonal antibody PD1 inhibitor in 2014 by the FDA, the number of same class drugs to treat cancer and viral infections has been on the rise. However, despite antibodies impressive success to treat cancer, recent studies expose several limitations of antibody therapy. To avoid the problems associated with antibody therapy, scientists are trying to discover small molecule inhibitors for the PD1/PDL1 pathway. A very limited number of small molecule inhibitors entered clinical trials at this point. In this paper, we have investigated ligand databases against PD1 and PDL1 separately to evaluate their prospects as potential small molecule inhibitors against PD1 and PDL1.
Materials and Methods
Methods to prepare protein and ligands
The crystal structures of PD1 and PDL1 protein have been reported in peer reviewed journals. The protein files were downloaded from online databases using the ID mentioned in journals. After some refinements, the protein file is made compatible to be used in computer software for molecular modeling [35]. The ligand files that will be docked in the model could be downloaded from large ligand libraries. Once ligand files are downloaded and refined, they are placed into a docking model against the target protein. The software algorithm can then run the ligand files to the protein and estimate the binding score [36]. We used Auto Dock Vina software for our molecular docking calculations PD1 (PDB ID: 5GGS) and PDL1 (PDB ID: 5J89) protein files were downloaded from the Protein Data Bank website [37- 39]. Auto Dock Tools was used to prepare protein files. The “Y” chain of the PD1 protein file and the “A” chain of the PDL1 protein file were identified and isolated. All water molecules and heteroatoms were deleted, and polar hydrogens were added to the protein file. Gasteiger charge was calculated, and grid box was adjusted to ensure it covers the active site residues. After making these changes, the PD1 and PDL1 protein files were saved separately
Molecular docking: High throughput virtual screening
In silico structure-based drug design is a technique which is very useful to find potential new ligands of a target protein by analyzing their interaction at the molecular level [40, 41]. Using computer generated simulation or molecular modeling, a large group of in silico compounds can be screened using various methods [42]. These compounds can then be ranked based on the binding interaction between the compound and the target protein predicted by computers which is expressed as “Binding score” [43, 44]. The advantage of this method is the ability to screen large number of compounds at low cost and relatively fast, compared to a high-throughput screening process [45].
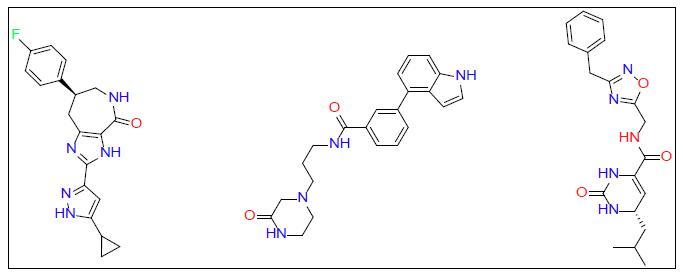
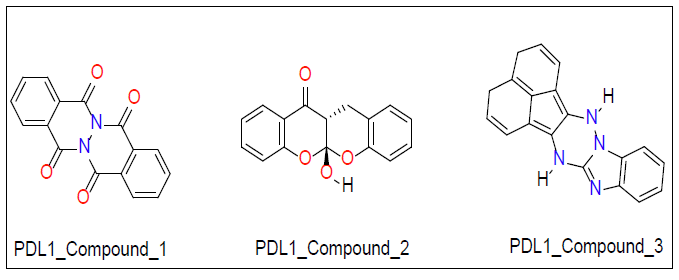
Once ligand files are downloaded and refined, they can be placed into a docking model against the target protein. The software algorithm can then run the ligand files to the protein and estimate the binding score. We used Auto Dock Vina software for our molecular docking calculations. Molecular docking studies were performed on PD1 and PDL1 protein using Auto Dock Vina software along with ZINC15 database [46]. The conformational energy of the ligands from the database was minimized using Avogadro software [47]. Explicit hydrogens were added to the ligand molecule and then its energy was minimized under the force field of MMFF94. Optimized ligands were docked against PD1 and PDL1 with the use of high throughput virtual screening. This allows for rapid screening of large libraries of ligands. Top ligands were selected based on their docking studies and then docked again in PyRx to verify docking results obtained from Auto Dock [48]. From this final screening three ligands for each protein receptor were selected that gave a minimum of -7.0 kcal/mol binding affinity against their respective target proteins (Figure 1 for PD1 inhibiting molecules and Figure 2 for PDL1 inhibitors).
Docking study and data processing
There are several commercially available software which can be used to simulate and analyze protein-ligand interactions. Using the software, we can identify the key interacting atoms that are involved in bond formation between receptor protein and the ligands, which allows us to make appropriate changes to the ligands to adjust or improve the binding interactions. PyMol, ChimeraX are some of the software that has been used by our lab [49].
ADME properties prediction
Absorption, Distribution, Metabolism, and Excretion (ADME) properties may be used to characterize the hit or lead compounds [50]. ADME properties are also important for preclinical pharmacokinetic evaluations and help to remove less favorable drug candidates [51]. SwissADME online software was used to predict different drug-like properties including molecular weight, hydrophilicity, lipophilicity, Topological Polar Surface Area (TPSA), GI absorption, etc. [52].
Molecular dynamics simulation
Molecular dynamics simulation is an effective tool to predict the natural motions of atoms involved in protein-ligand complex system for a certain time. These predictions, in turn, could be very useful to investigate biomolecular processes like conformational changes, ligand binding mode, etc. [53]. Molecular dynamics work based on the forces acting on atoms according to classical equations of motion [54]. The reason we need MD analysis for our protein-ligand system is because the molecular docking tools do not account for the flexible nature of the protein’s structure while giving the docking score. MD simulation analysis could be used to overcome this limitation. A good ligand docking pose will presumably generate a stable MD trajectory while a bad docking pose will do the opposite. A low Root Mean Square Deviation (RMSD) from the initial conformation of the ligand will indicate stability of the docking mode [55]. MD simulation also takes the solvent molecule’s influence into consideration while predicting the stability of protein-ligand complex [56]. Thus, MD simulation could be an effective tool to refine and validate the data obtained from molecular docking tools. We used GROMACS package to analyze the stability of protein-ligand complex as a mean to justify our docking results [57]. To execute the simulation, we employed CHARMM 36 force field to dictate the protein-ligand dynamics along with TIP3P water model for solvation of the complex [58, 59]. To neutralize the solvated system, counter ions have been added to the complex and then energy minimized. Reference temperature was set at 300 K, along with a reference pressure of 1.0 bar for the dynamics study. The run time for the simulation was set at 1 nano-second. At the end of the simulation, the RMSD values for ligand and protein backbone were obtained and plotted in an excel sheet. In addition, the RMSF values for the protein residues at C-alpha position were also plotted in the same way.
Results and Discussion
Selection of small molecule inhibitors for PD1 and PDL1
Top ligands were selected based on their docking studies from Auto Dock and then verified by redocked in PyRx. From this final screening, three ligands for each protein receptor were selected that gave a minimum of -7.0 kcal/mol binding affinity against their respective target proteins (Figure 1 for PD1 inhibitors and Figure 2 for PDL1 inhibitors).
Docking results
Each compound was docked against a PD1 protein or PDL1 natural ligand. The interaction between our ligands and PD1 or PDL1 was analyzed using PyMol and Discovery Studio Visualizer software. Table 1 represents the docking score for original structures and scores after modification.
TABLE 1. Docking score of hit compounds
| Original structure Name | Binding Score (kcal/mol) | Modified Structure name | Binding Score (kcal/mol) |
|---|---|---|---|
| PD1_Compound-1 | -7.5 | ||
| PD1_Compound-2 | -7.4 | ||
| PD1_Compound-3 | -7 | ||
| PDL1_Compound-1 | -7.1 | ||
| PDL1_Compound-2 | -7.3 | ||
| PDL1_Compound-3 | -7.8 |
ADME properties
Table 2 provides important information about the ADME properties of the lead compounds.
TABLE 2. Relevant physical properties for the compounds of interest
| Name | Molecular weight g/mol | MLogP | TPSA | LogS(ESOL) | GI Absorption |
|---|---|---|---|---|---|
| PD1_Compound_1 | 351.38 | 2.18 | 86.46A°2 | -3.64 | High |
| PD1_Compound_2 | 376.46 | 1.58 | 77.23A°2 | -3.66 | High |
| PD1_Compound_3 | 369.42 | 0.93 | 109.15A°2 | -3.35 | High |
| PDL1_Compound_1 | 292.25 | 3.52 | 77.10A°2 | -3.37 | High |
| PDL1_Compound_2 | 268.26 | 2.06 | 55.76A°2 | -3.53 | High |
| PDL1_Compound_3 | 298.34 | 4.25 | 48.88A°2 | -4.11 | High |
Binding mode of PD1_Compound_1
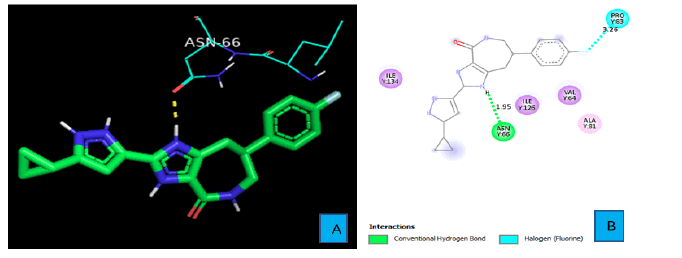
PyMOL and discovery studio visualizer were used to analyze protein-ligand interactions for each compound. Figures 3A and 3B show the hydrogen bond and other interactions between PD1 and the ligand. One of the Imidazole rings of PD1_Compound_1 forms a hydrogen bond with PD1. The hydrogen atom of the imidazole ring contacts with an oxygen atom of ASN side chain from a distance of 1.95 A° and constitutes the only hydrogen bond between PD1 and PD1_Compound_1. Another important protein ligand interaction could be seen between the fluorine atoms of PD1_Compound_1and the PRO 83 side chain of PD1 with a bond distance of 3.26A°.
Binding mode of PD1_Compound_2
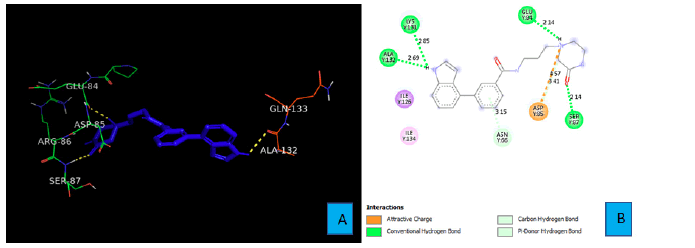
PD1_Compound_2 develops four hydrogen bonds with the side chains of PD1. A hydrogen atom of the secondary amine of the indole ring forms the first two hydrogen bonds with the side chain of LYS 131 and ALA 132 (Figure 4A). The bond distances of these two hydrogen bonds were 2.85A° and 2.69A° respectively. The six membered lactam ring of PD1_Compound_2 gives two more hydrogen bonds. The oxygen atom of the amide bond interacts with side chain SER 87 from a distance of 2.14A° to form a hydrogen bond. The last hydrogen bond comes from a tertiary nitrogen atom of the lactam ring. This tertiary nitrogen atom comes into contact of a hydrogen atom of GLU 84 to demonstrate a hydrogen bond. The bond distance of this hydrogen bond turned out to be 2.14A° (Figure 4B).
Binding mode of PD1_Compound_3
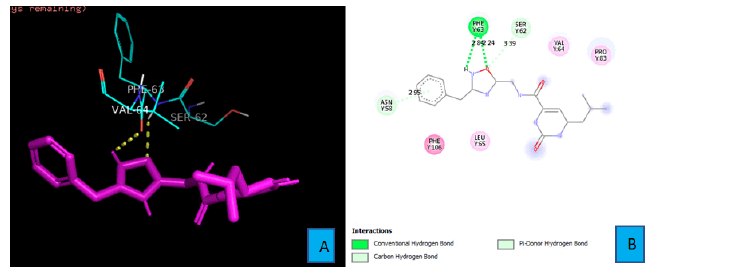
PD1_Compound_3 forms just two hydrogen bonds with PD1. An oxygen atom and a hydrogen atom of PHE 63 residue forms these two bonds (Figure 5A and 5B). The oxygen atom from the isoxazole ring of PD1_Compound_3 interacts with a hydrogen atom of PHE 63 from a distance of 2.24A°. The neighboring amine’s hydrogen atom also contacts with the oxygen atom of the same PHE 63 side chain to form the second hydrogen bond (Figure 5B).
The bond distance of this bond was 2.84A°. In addition, there is a pi-Donor hydrogen bond between the benzene ring and side chain ASN 58 from a distance of 2.95A°.
Binding mode of PDL1_Compound_1
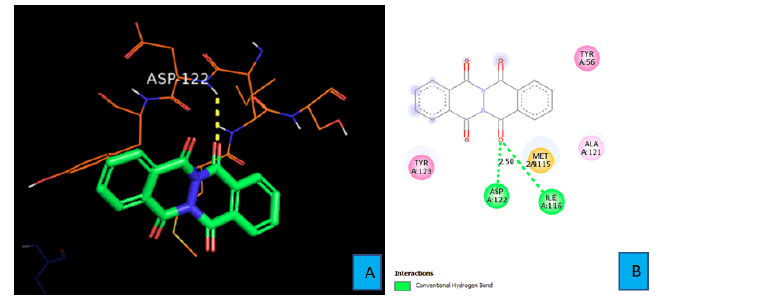
Figures 6A and 6B show the interactions between natural ligand PDL1 and PDL1_Compound_1. Two hydrogen bonds were identified using Discovery Studio Visualizer software. The first hydrogen bond was formed between the oxygen atom of one of the fused cyclohexanone ring of PDL1_Compound_1 and the hydrogen atom of amine group of ASP 122 side chain. The bond distance was found to be 2.50 A° in this case (Figure 6B). The second hydrogen bond came from the same oxygen atom of the cyclohexanone ring. The amine hydrogen atom of ILE 116 contacted with that oxygen atom from a distance of 2.90 Ao and formed the second hydrogen bond. (Figure 6B)
Binding mode of PDL1_Compound_2
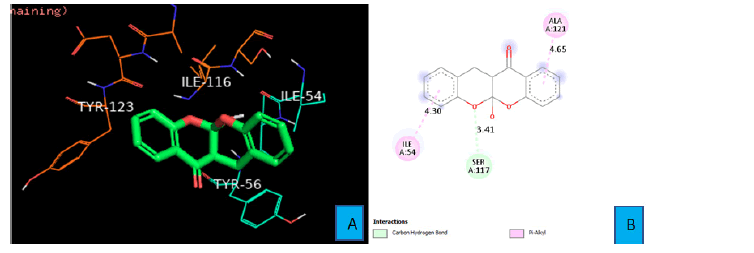
Weak carbon hydrogen bond was observed between SER 117 side chain and the oxygen atom of one of the fused oxane ring of PDL1_Compound_2. The bond distance was found to be 3.41 A° Pi- Alkyl interaction was seen between a benzene ring of PDL1_Compound_2 and the side chain of ILE 54 from a distance of 4.30 A°. Same type of interaction was also observed between the second benzene ring of PDL1_Compound_2 and ALA 121 residue at a distance of 4.65 A° (Figure 7A and 7B).
Binding mode of PDL1_Compound_3
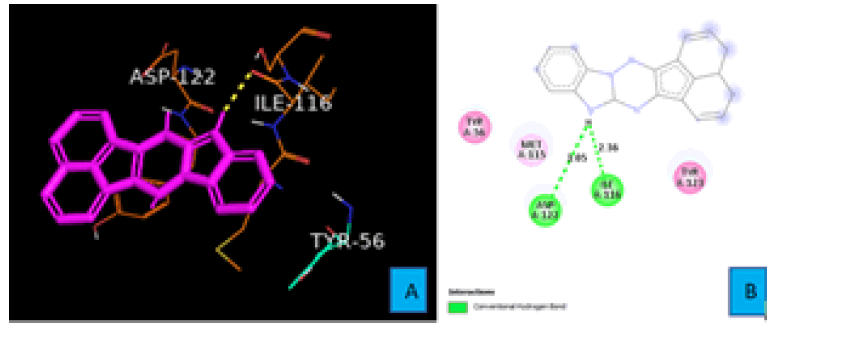
PDL1_Compound_3 formed two hydrogen bonds with PDL1 (Figure 8A and 8B). A hydrogen atom of the five membered cyclic amine forms both two hydrogen bonds. First one with the oxygen atom of ILE 116 residue from a distance of 2.36 A°. The same hydrogen atom also interacted with another oxygen atom of ASP 122 to create the second hydrogen bond. The bond distance of this hydrogen bond turned out to be 3.05 A° (Figure 8B).Proposed modifications of PD1 and PDL1 compounds
Proposed modifications of PD1 and PDL1 compounds
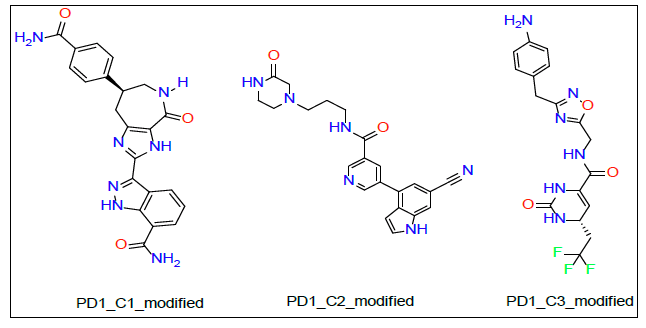
As shown in Figure 3A and 3B, PD1_Compound_1 formed only one hydrogen bond with its receptor protein. Surrounding amino acid residues VAL, ALA, ILE were not involved in any strong interaction with the ligand. Replacing the cyclopropane group with a more electron rich functiona group is expected to increase protein-ligand interaction and thereby improve binding affinity. Based on Figure 4A and 4B, PD1_Compound_2 has a long aliphatic chain which makes the molecule less rigid. Increasing the rigidity of this molecule using pyrazole or furan to replace rotatable aliphatic chain will probably help to improve binding score. According to Figure 5A and 5B, PD1_Compound_3 has an iso-propane group with limited interaction with receptor protein. Adding halogen atoms in this group might be a good idea to increase interaction. Adding heteroatoms in the benzene ring will probably also be helpful. Based on the above-mentioned information, several modifications were made to the PD1 hit compounds (Figure 9). These changes are expected to increase protein-ligand interactions and thereby improve binding scores. Now, we are going to shed some light on PDL1 compounds. Figure 6A and 6B shows that PDL1_Compound_1 has fused benzene rings with no functional group attached. Adding a functional group to these benzene rings should improve protein ligand interaction leading to higher binding score by interacting with, TYR, ALA or MET side chains of PDL1. As per Figure 7, PDL1_compound_2 did not form any hydrogen bond with PDL1. Hence, adding functional groups in the benzene rings or heteroatoms like nitrogen or oxygen is expected to lead towards hydrogen bond formation with neighboring side chain residues like ALA or ILE. PDL1_Compound_3 also has fused benzene ring without any heteroatom or functional groups. The neighboring amino acid residues of this area are MET and TYR. So, adding amide group or carboxylic group might be a good strategy to enhance protein ligand interactions to achieve higher binding affinity. Similar modifications made on PD1 compounds will also be made to improve the binding scores of PDL1 compounds. Molecular dynamics data will be obtained after making necessary changes for further analysis.
Molecular Dynamics Simulation Analysis Of Pd1 And One Of Its Hit Compounds
Molecular dynamics simulations have been performed for PD1_ Compound_1 against PD1 and PDL1_Compound_2 against PDL1
MD Analysis of PD1_Compound_1
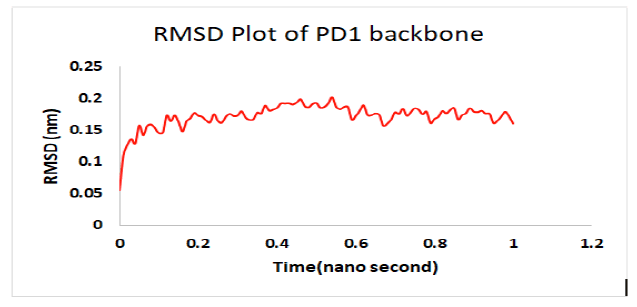
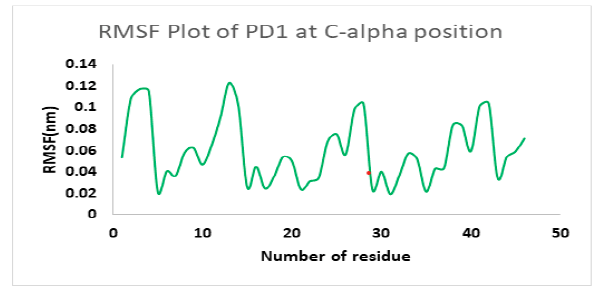
Molecular dynamics simulation indicates a fairly stable complex during simulation with low RMSD value. PD1_compound_1 was chosen for MD simulation against PD1. Ligand RMSDs fluctuated between 0.5 A° and 3.4 A°during a 1 ns simulation. The RMSD plot of the protein backbone demonstrated strong stability with a fluctuation of only 0.8 A°. The RMSD values remained between 1.2 Aͦ and 2.0 Aͦ during the 1ns simulation. Figure 10 showed the RMSD values of protein backbone while the Root Mean Square Fluctuation (RMSF) value for c-alpha atoms in PD1 residues have been illustrated in Figure 11. The peaks in RMSF plot reveal the residues that fluctuated most during simulation. Residues 10-15 and residues 23-29 showed highest fluctuation over the course of 1ns simulation ranging from 0.2 A° and 1.2 A°.
MD analysis of PDL1_Compound_2
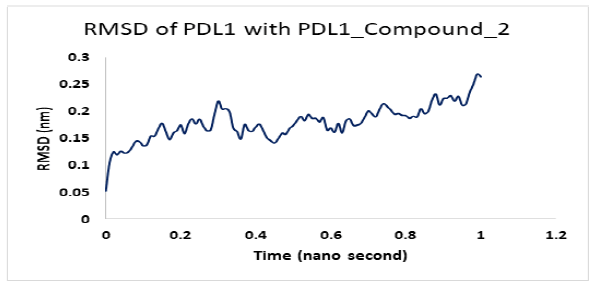
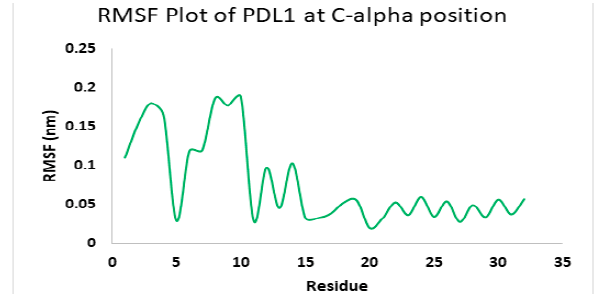
Molecular dynamics simulation for PD1_compound_3 against PDL1 showed good stability. Ligand RMSDs fluctuated between 0.5 A° and 1.5 A° during a 1ns simulation. The RMSD plot of the protein backbone indicated a moderate stability with a fluctuation of 2.0 Aͦ, ranging from 0.5 A° to 2.6 A°. Figure 12 shows the RMSD values of protein backbone. The Root Mean Square Fluctuation (RMSF) value for c-alpha atoms in PDL1 residues have been shown in Figure 13. The peaks in RMSF plot show the residues that fluctuated most during simulation. Residues 5-10 showed high fluctuations between 0.2 A° to 1.8 A° at the beginning, then residues 10-15 showed another small peak of fluctuations ranging from 0.3 Aͦ to 1.8 Aͦ.. Residue 16-32 seemed pretty stable (Figure 13).
Conclusion
We have screened about half a million compounds from ZINC 15 database trying to find a suitable small molecule inhibitor for PD1 and PDL1 cycle. Our strategy involved identifying the PD1/PDL1 proteins that are responsible for the inception and progression of several types of cancers and acute viral infections. We used the crystal structures of the proteins of interest that were reported in literature to identify the binding region and corresponding amino acid side chains. Next, large number of compound strcutures was screened using High Throuput Virual Screening (HTSV) technique. Based on our computational studies, several hit compounds were discovered with promising predicted drug-like properties. After proposed modification, we expect to develop novel PD1/PDL1 inhibitors which will go for clinical studies and eventually get approval from the FDA.
References
- Patsoukis N.; Wang Q.; Strauss L.; et al. Revisiting the PD-1 pathway. Sci Adv. 2020;6(38).
- Gong J.; Chehrazi-Raffle A.; Reddi S.; et al. Development of PD-1 and PD-L1 inhibitors as a form of cancer immunotherapy: a comprehensive review of registration trials and future considerations. J. Immuno Ther Cancer. 2018;6(1):8.
- Freeman GJ.; Long AJ.; Iwai Y.; et al. Engagement of the PD-1 immunoinhibitory receptor by a novel B7 family member leads to negative regulation of lymphocyte activation. J Exp Med. 2000;192(7):1027-34.
- Han Y.; Liu D.; Li L. PD-1/PD-L1 pathway: current researches in cancer. Am J Cancer Res. 2020;10(3):727-42.
- De Sousa Linhares, A.; Battin C.; Jutz S.; et al. Therapeutic PD-L1 antibodies are more effective than PD-1 antibodies in blocking PD-1/PD-L1 signaling. Scientific Reports. 2019;9(1):11472.
- Horita S.; Nomura Y.; Sato Y. et al. High-resolution crystal structure of the therapeutic antibody pembrolizumab bound to the human PD-1. Sci Rep. 2016;6:35297.
- Tan S.; Zhang H.; Chai Y.; et al. An unexpected N-terminal loop in PD-1 dominates binding by nivolumab. Nature Communications. 2017;8(1):14369.
- Zak KM.; Grudnik P.; Magiera K.; et al. Structural Biology of the Immune Checkpoint Receptor PD-1 and Its Ligands PD-L1/PD-L2. Structure. 2017;25(8):1163-1174.
- Guzik K.; Tomala M.; Muszak D.; et al. Development of the Inhibitors that Target the PD-1/PD-L1 Interaction-A Brief Look at Progress on Small Molecules, Peptides and Macrocycles. Molecules. 2019;24(11).
- Dai S.; Jia R.; Zhang X.; et al. The PD-1/PD-Ls pathway and autoimmune diseases. Cell Immunol. 2014;290(1):72-9.
- Jiang Y.; Chen M.; Nie H.; et al. PD-1 and PD-L1 in cancer immunotherapy: clinical implications and future considerations. Hum Vaccin Immunother. 2019;15(5):1111-22.
- Mc Nally B.; Ye F.; Willette M.; et al. Local Blockade of Epithelial PDL-1 in the Airways Enhances T Cell Function and Viral Clearance during Influenza Virus Infection. J.Virol. 2013;87(23):12916-24.
- Lu P.; Youngblood BA.; Austin J. et al. Blimp-1 represses CD8 T cell expression of PD-1 using a feed-forward transcriptional circuit during acute viral infection. J. Exp. Med. 2014;211(3):515-27.
- Sun C.; Mezzadra R.; Schumacher T. N., Regulation and Function of the PD-L1 Checkpoint. Immunity. 2018;48(3):434-52.
- Gauen LK.; Zhu Y.; Letourneur F.; et al. Interactions of p59fyn and ZAP-70 with T-cell receptor activation motifs: defining the nature of a signalling motif. Mol Cell Biol. 1994;14(6):3729-41.
- Zak KM.; Kitel R.; Przetocka S.; e al. Structure of the Complex of Human Programmed Death 1, PD-1, and Its Ligand PD-L1. Structure. 2015;23(12):2341-48.
- Muenst S.; Soysal S. D.; Gao F. et al. The presence of programmed death 1 (PD-1)-positive tumor-infiltrating lymphocytes is associated with poor prognosis in human breast cancer. Breast Cancer Res Treat. 2013;139(3):667-76.
- Ahmadzadeh M.; Johnson LA.; Heemskerk B.; et al. Tumor antigen-specific CD 8 T cells infiltrating the tumor express high levels of PD-1 and are functionally impaired. Blood. 2009;114(8):1537-44.
- Huang D.; Wen W.; Liu X.; et al. Computational analysis of hot spots and binding mechanism in the PD-1/PD-L1 interaction. RSC Advances. 2019;9(26):14944-56.
- Alsaab HO.; Sau S.; Alzhrani R.; et al. PD-1 and PD-L1 Checkpoint Signaling Inhibition for Cancer Immunotherapy: Mechanism, Combinations, and Clinical Outcome. Front Pharmacol. 2017;8:561.
- Porichis F.; Kaufmann DE., Role of PD-1 in HIV pathogenesis and as target for therapy. Curr HIV/AIDS Rep. 2012;9(1):81-90.
- Velu V.; Shetty R. D.; Larsson M.; et al. Role of PD-1 co-inhibitory pathway in HIV infection and potential therapeutic options. Retrovirology. 2015;12:14.
- Gao Y.; Wang H.; Shen L.; et al. Discovery of benzo[d]isothiazole derivatives as novel scaffold inhibitors targeting the programmed cell death-1/programmed cell death-ligand 1 (PD-1/PD-L1) interaction through "ring fusion" strategy. Bioorg Chem. 2022;123:105769.
- Armand P.; Nagler A.; Weller EA.; et al. Disabling immune tolerance by programmed death-1 blockade with pidilizumab after autologous hematopoietic stem-cell transplantation for diffuse large B-cell lymphoma: results of an international phase II trial. J Clin Oncol. 2013;31(33):4199-206.
- Westin J. R.; Chu F.; Zhang M.; et al. Safety and activity of PD1 blockade by pidilizumab in combination with rituximab in patients with relapsed follicular lymphoma: a single group, open-label, phase 2 trial. Lancet Oncol. 2014;15(1):69-77.
- Berger R.; Rotem-Yehudar R.; Slama G.; et al. Phase I safety and pharmacokinetic study of CT-011, a humanized antibody interacting with PD-1, in patients with advanced hematologic malignancies. Clin Cancer Res. 2008;14(10):3044-51.
- Andorsky DJ.; Yamad R E.; Said J.; et al. Programmed death ligand 1 is expressed by non-hodgkin lymphomas and inhibits the activity of tumor-associated T cells. Clin Cancer Res. 2011;17(13):4232-44.
- Rizvi N. A.; Mazières J.; Planchard D.; et al. Activity and safety of nivolumab, an anti-PD-1 immune checkpoint inhibitor, for patients with advanced, refractory squamous non-small-cell lung cancer (CheckMate 063): a phase 2, single-arm trial. Lancet Oncol. 2015;16(3):257-65.
- Garon EB.; Rizvi NA.; Hui R.; et al. Pembrolizumab for the Treatment of Non–Small-Cell Lung Cancer. New Engl J Med. 2015;372(21):2018-28.
- Yin Z.; Yu M.; Ma T.; et al. Mechanisms underlying low-clinical responses to PD-1/PD-L1 blocking antibodies in immunotherapy of cancer: a key role of exosomal PD-L1. J Immunother Cancer. 2021;9(1).
- Postow M. A., Managing immune checkpoint-blocking antibody side effects. Am Soc Clin Oncol Educ Book. 2015;76-83.
- Zarganes-Tzitzikas T.; Konstantinidou M.; Gao Y.; et al. Inhibitors of programmed cell death 1 (PD-1): a patent review (2010-2015). Expert Opin Ther Pat. 2016;26(9):973-7.
- Wang T.; Cai S.; Cheng Y.; et al. Discovery of Small-Molecule Inhibitors of the PD-1/PD-L1 Axis That Promote PD-L1 Internalization and Degradation. J Med Chem. 2022;65(5):3879-93.
- Wu Q.; Jiang L.; Li S.; et al. Small molecule inhibitors targeting the PD-1/PD-L1 signaling pathway. Acta Pharmacologica Sinica. 2021;42(1):1-9.
- Morris GM, Lim-Wilby M. Molecular docking. Mol model Proteins. 2008:365-82.
- Madhavi Sastry G.; Adzhigirey M.; Day T et al. Protein and ligand preparation: parameters, protocols, and influence on virtual screening enrichments. J. Comput.-Aided Mol Des. 2013;27(3):221-34.
- Morris GM.; Huey R.; Lindstrom W.; et al. AutoDock4 and AutoDockTools4: Automated docking with selective receptor flexibility. J Comput Chem. 2009;30(16):2785-91.
- Berman HM.; Westbrook J.; Feng Z.; et al. The Protein Data Bank. Nucleic Acids Res. 2000;28(1):235-42.
- Lee JY.; Lee HT.; Shin W.; et al. Structural basis of checkpoint blockade by monoclonal antibodies in cancer immunotherapy. Nat Commun. 2016;7(1):13354.
- Ekins S.; Mestres J.; Testa B., In silico pharmacology for drug discovery: methods for virtual ligand screening and profiling. Br J Pharmacol. 2007;152(1):9-20.
- Brogi S.; Ramalho T. C.; Kuca K.; et al. Editorial: In silico Methods for Drug Design and Discovery. Front Chem. 2020;8.
- Terstappen GC.; Reggiani A. In silico research in drug discovery. Trends Pharmacol Sci. 2001;22(1):23-26.
- Hall Jr DC, Król JE, Cahill JP, et al. The development of a pipeline for the identification and validation of small-molecule RelA inhibitors for use as anti-biofilm drugs. Microorganisms. 2020;8(9):1310.
- Rognan D., The impact of in silico screening in the discovery of novel and safer drug candidates. Pharmacol Ther. 2017;175:47-66.
- Kalyaanamoorthy S.; Chen YPP., Structure-based drug design to augment hit discovery. Drug Discov Today. 2011;16(17):831-9.
- Sterling T.; Irwin JJ. ZINC 15 – Ligand Discovery for Everyone. J. Chem. Inf. Model. 2015;55(11):2324-37.
- Hanwell MD.; Curtis DE.; Lonie DC.; et al. Avogadro: an advanced semantic chemical editor, visualization, and analysis platform. J Cheminformatics. 2012,4(1),17.
- Dallakyan S.; Olson AJ. Small-molecule library screening by docking with PyRx. Methods. Mol Biol. 2015;1263:243-50.
- Pettersen EF.; Goddard TD.; Huang CC.; et al. UCSF ChimeraX: Structure visualization for researchers, educators, and developers. Protein Sci. 2021;30(1):70-82.
- Haldar P.; Barman G.; Ray JK., Sodium borohydride–iodine mediated reduction of γ-lactam carboxylic acids followed by DDQ mediated oxidative aromatisation: a simple approach towards N-aryl-formylpyrroles and 1,3-diaryl-formylpyrroles. Tetrahedron. 2007;63(14):3049-56.
- Ilaria B., Alina C.; Federica F.; et al. Heterocyclic compounds used in the treatment of kinetoplastid infection and their preparation. WO. 2018;115275
- Daina A.; Michielin O.; Zoete V. SwissADME: a free web tool to evaluate pharmacokinetics, drug-likeness and medicinal chemistry friendliness of small molecules. Scientific Reports. 2017;7(1):42717.
- Hollingsworth SA.; Dror RO. Molecular Dynamics Simulation for all. Neuron. 2018;99(6):1129-43.
- Allen MP. Introduction to molecular dynamics simulation. Computational soft matter: from synthetic polymers to proteins. 2004;23(1):1-28.
- De Vivo M.; Masetti M.; Bottegoni G.; et al. Role of Molecular Dynamics and Related Methods in Drug Discovery. J Med Chem. 2016;59(9):4035-61.
- Defelipe LA.; Arcon JP.; Modenutti CP.; et al. Solvents to Fragments to Drugs: MD Applications in Drug Design. Molecules. 2018;23(12).
- Abraham MJ.; Murtola T.; Schulz R.; et al. GROMACS: High performance molecular simulations through multi-level parallelism from laptops to supercomputers. SoftwareX. 2015;19-25.
- Vanommeslaeghe K.; Hatcher E.; Acharya C. et al CHARMM general force field: A force field for drug-like molecules compatible with the CHARMM all-atom additive biological force fields. J Comput Chem. 2010;31(4):671-90.
- Mark P.; Nilsson L. Structure and Dynamics of the TIP3P, SPC, and SPC/E Water Models at 298 K. J Phys Chem A. 2001;105(43):9954-60.


